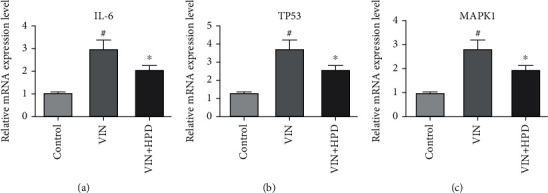
Figure 8.

Validation of hub genes. qRT-PCR analysis for differences in mRNA expressions of IL-6 (a), TP53 (b), and MAPK1 (c) in the different groups. Results were expressed as mean ± SD (n = 3). #P < 0.05, the VIN group compared with the control group; ∗P < 0.05, the VIN+HPD group compared with the VIN-treated group.
