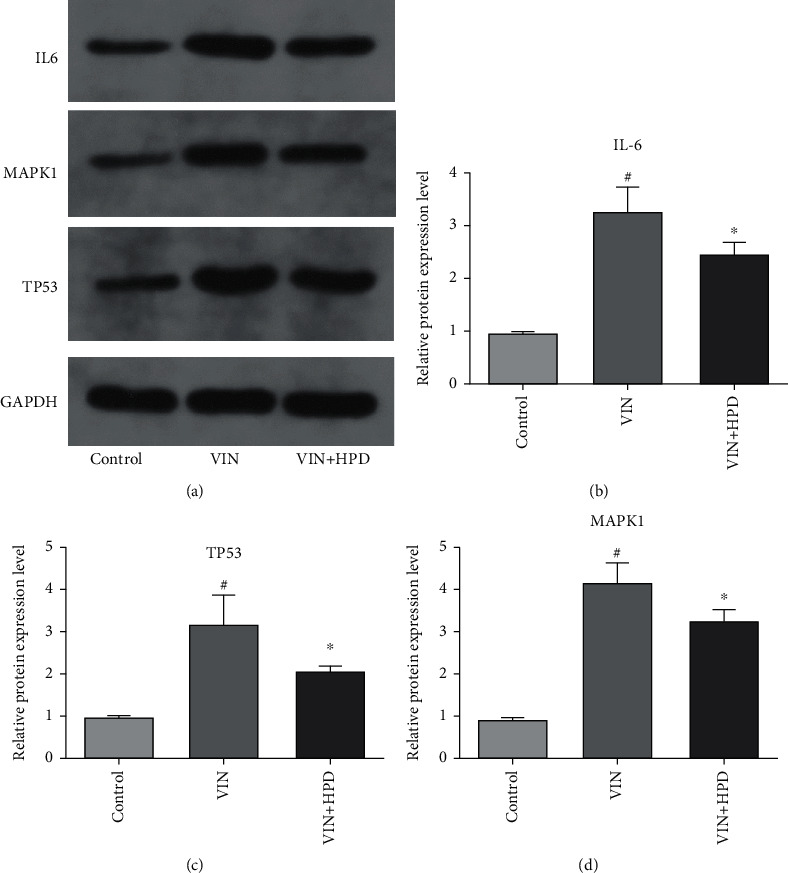
Figure 9.

Validation of hub genes via western blot analyses. (a) Representative western blot analyses of IL-6, MAPK1, TP53, and GAPDH. The normalized optical density of IL-6 (b), TP53 (b), and MAPK1 (d). Results were expressed as mean ± SD (n = 3). #P < 0.05, the VIN group compared with the control group; ∗P < 0.05, the VIN+HPD group compared with the VIN-treated group.
