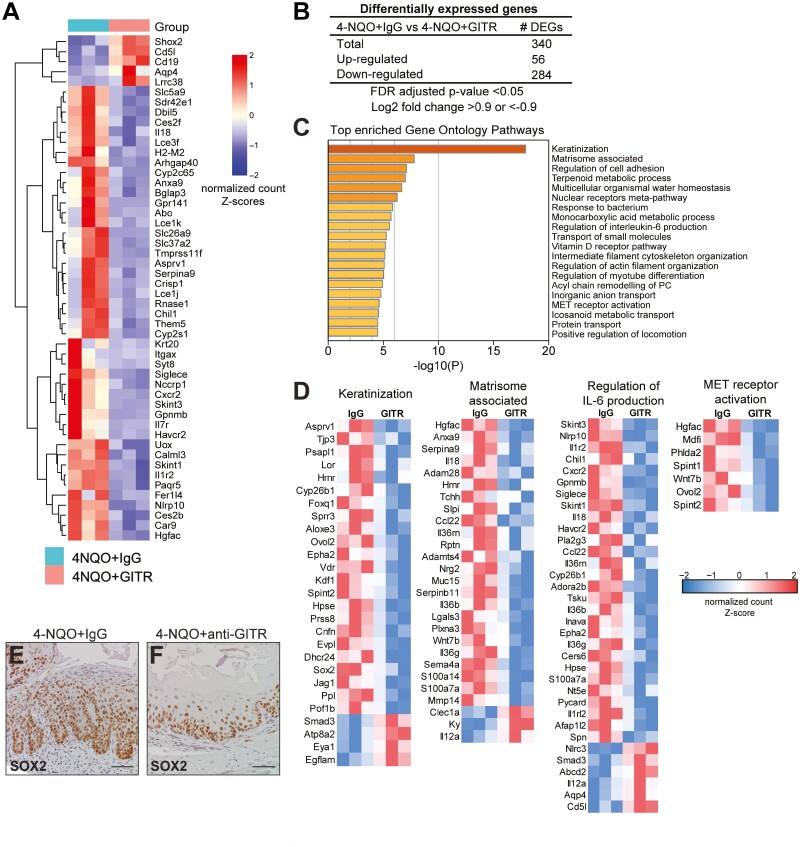
Figure 5.
Transcriptomic analysis identifies pathways differentially regulated by GITR agonistic stimulation in mice treated with 4-NQO. (A) RNA sequencing was performed from mouse esophageal tissue treated with 4-NQO, with IgG or anti-GITR. Heat map shows the log2 fold change for all DEGs identified from RNA-seq. n = 3 mice per group. (B) DEGs from 4-NQO/anti-GITR mice compared to controls are shown. (C) The enrichment of functional pathways was identified by Gene Ontology using DEGs from 4-NQO/anti-GITR mice compared to controls, and the top 20 pathways are shown. (D) Heatmaps show normalized expression values of genes responsible for the enrichment of selected pathways. n = 3 mice per group. (E, F) Representative immunohistochemistry for SOX2 is shown in mouse esophageal sections from 4-NQO/ anti-GITR mice (F) compared to 4-NQO/IgG mice (E).

