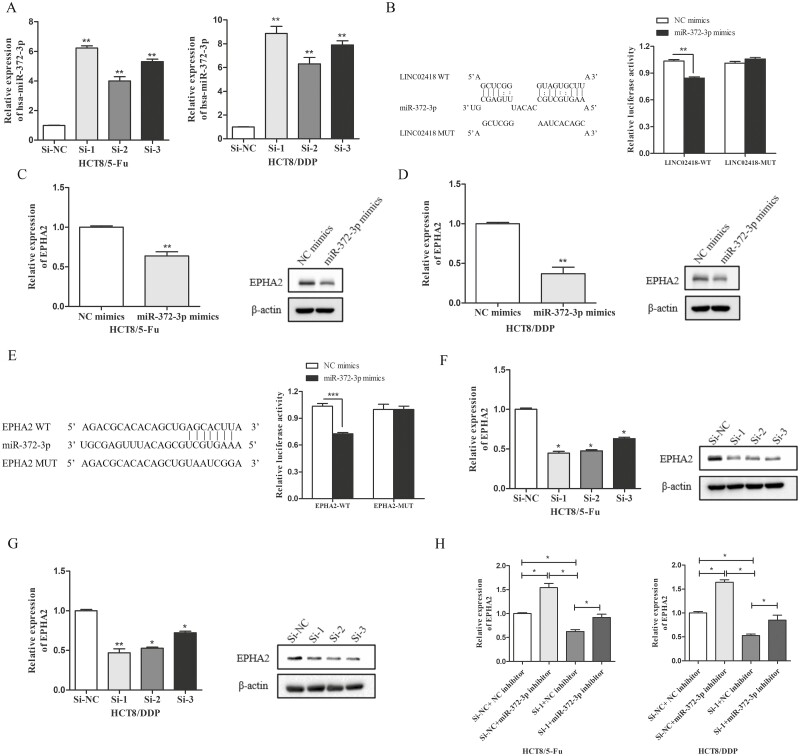
Figure 6.
LINC02418 functions as a molecular sponge for miR-372-3p to regulate EPHA2. (A) The expression levels of miR-372-3p in HCT8/5-Fu and HCT8/DDP cells following knockdown of LINC02418 were evaluated by qRT-PCR. (B) The potential interaction sites between miR-372-3p and LINC02418 were predicted with bioinformatics analysis. Dual-luciferase reporter assay was applied to demonstrate the combination between miR-372-3p and LINC02418 in 293T cells. The expression levels of EPHA2 in HCT8/5-Fu (C) and HCT8/DDP cells (D) transfected with miR-372-3p mimics or NC mimics were evaluated by qRT-PCR and western blotting. (E) Schematic diagram of putative base pairing between miR-372-3p and EPHA2. Luciferase activity was measured in 293T cells cotransfected with pmirGLO-EPHA2-WT or pmirGLO-EPHA2-MUT and miR-372-3p mimics. The mRNA and protein levels of EPHA2 in HCT8/5-Fu (F) and HCT8/DDP cells (G) transfected with si-LINC02418 were detected by qRT-PCR and western blotting assay. (H) EPHA2 mRNA levels in HCT8/5-Fu and HCT8/DDP cells transfected with si-NC + miR-NC inhibitor, si-LINC02418 + miR-NC inhibitor, si-NC + miR-372-3p inhibitor and si-LINC02418 + miR-372-3p inhibitor were detected by qRT-PCR. Data are shown as mean ± SD, and the results represent three independent experiments, *P < 0.05, **P < 0.01, ***P < 0.001.

