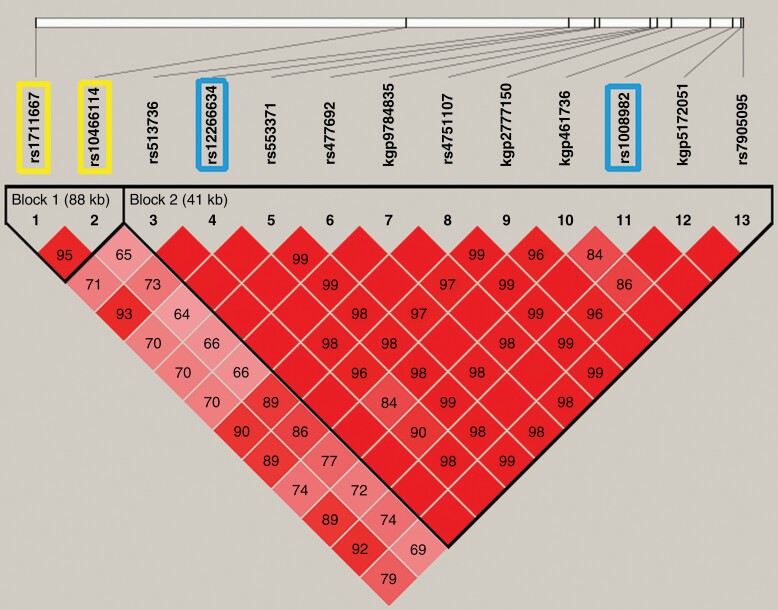
Figure 3.
Linkage disequilibrium (LD) plot of MGMT SNPs identified at E-7 level and haplotype-block structure. The values indicate the LD relationship between each pair of SNPs; darker shading denotes a greater extent of LD between SNPs. The SNPs selected for inclusion in the haplotype analysis sufficiently capture the variation represented in this region of MGMT.

