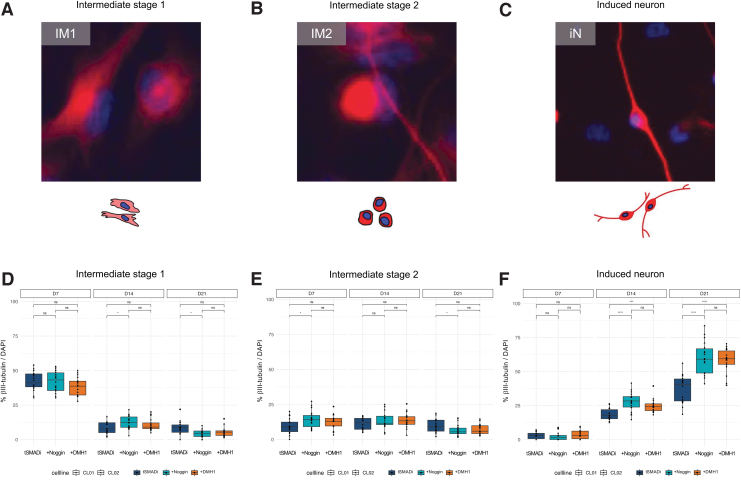
FIG. 4.
(A) Cell type of IM1. Weak βIII-tubulin staining, no neuronal morphology. (B) Cell type of IM2. Strong βIII-tubulin staining, no neuronal morphology. (C) iN. Strong βIII-tubulin staining, neuronal morphology. (D–F) Quantification of immunofluorescent images of IM1 (D), IM2 (E), and iNs (F) in CL01 and CL02 for βIII-tubulin/DAPI during conversion. Significance: t-test; *: p ≤ 0.05; ***: p ≤ 0.01; ****: p ≤ 0.001. Staining: βIII-tubulin (red), DAPI (blue). IM1, intermediate stage 1; IM2, intermediate stage 2.

