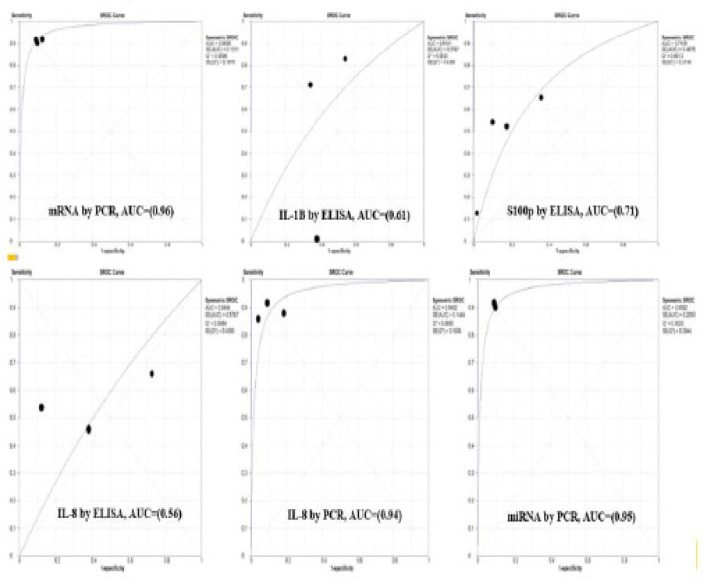
Figure 10.
The Area under the Curve (AUC) with Summary Receiver Operating Characteristics (SROC) Curve was Plotted for all the Biomarkers with Their Estimation Method as Shown in Figure 10. Note: The highest AUC was seen for mRNA (0.96) and miRNA (0.95) estimated by PCR which was considered excellent and the lowest AUC was seen for IL-8 (0.56) estimated by ELISA which was considered poor

