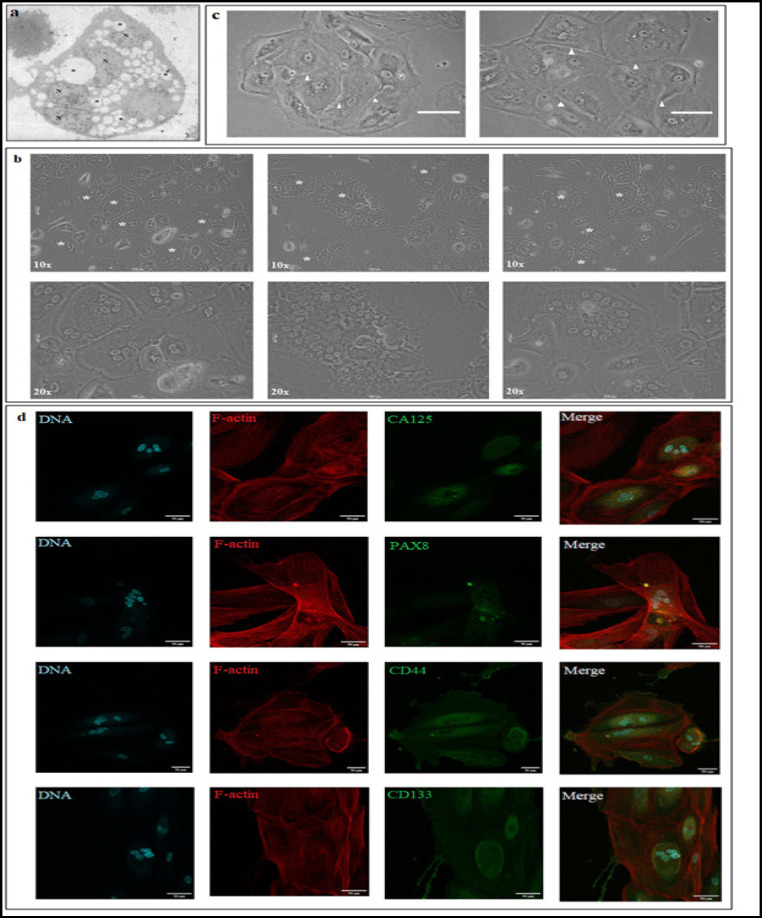
Figure 2.
Multinucleation in Primary OC Spheroids. (a)Electron micrograph of showing multinucleated cell in patient derived spheroid. (*: LD,N: NUCLEUS) Scale: 10μm. (b) Phase contrast micrograph of multinucleated cells derived from metastatic OC spheroids. [* represent multinucleated cells; upper panel represents images acquired in 10x. magnification and lower panel images acquired in 20x magnification] Scale:100μm. (c) Asymmetric cell division with septum –like formation in multinucleated cells (white arrow heads show the septum-like structure that forms during asymmetric division). (d) Expression and immunolocalization of cancer and stem cell markers in MNCs. Scale: 50μm

