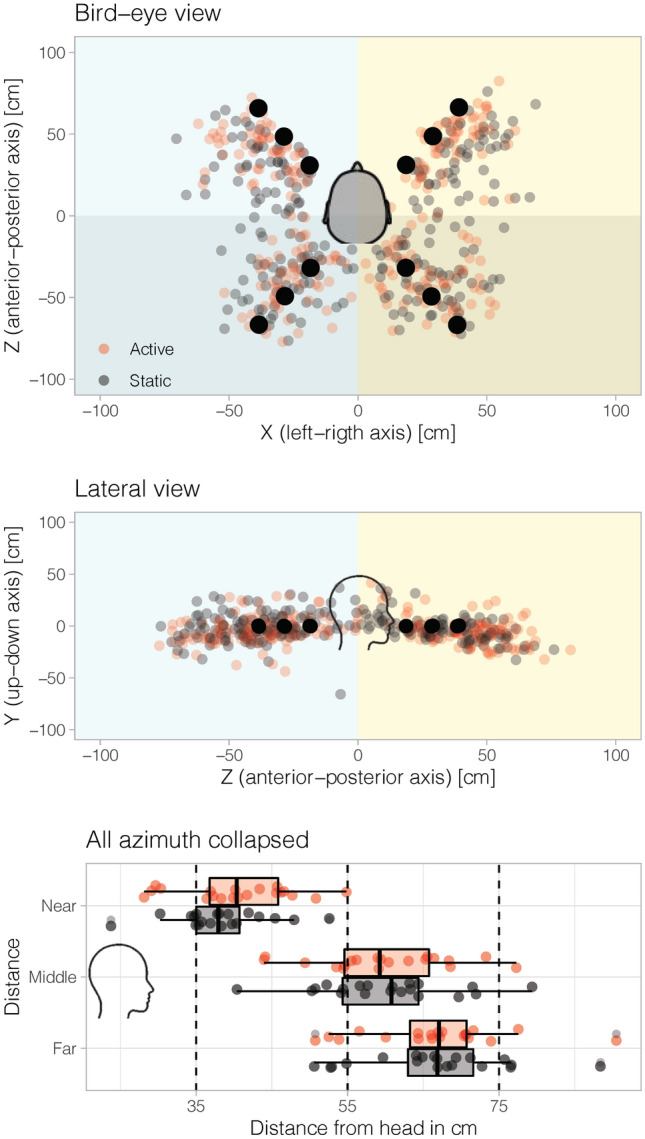
Fig. 4.

Behavioral pointing and effects of static and active listening on sound localization. A Bird’s-eye view of all target positions (black dots) and hand-pointing responses (smaller gray and red circles) for each participant, averaged across trials in a quadrant (i.e., front-left, front-right, back-left, back-right) irrespective of sound distance. Color code is a function of listening condition (black: static listening; red: active listening). B Lateral view of all target positions and responses. Responses for each participant are averaged across (left or right) and distance (near, middle or far). C Lateral view of responses in depth (black box plot: static listening; red box plot: active listening). All participants were included
