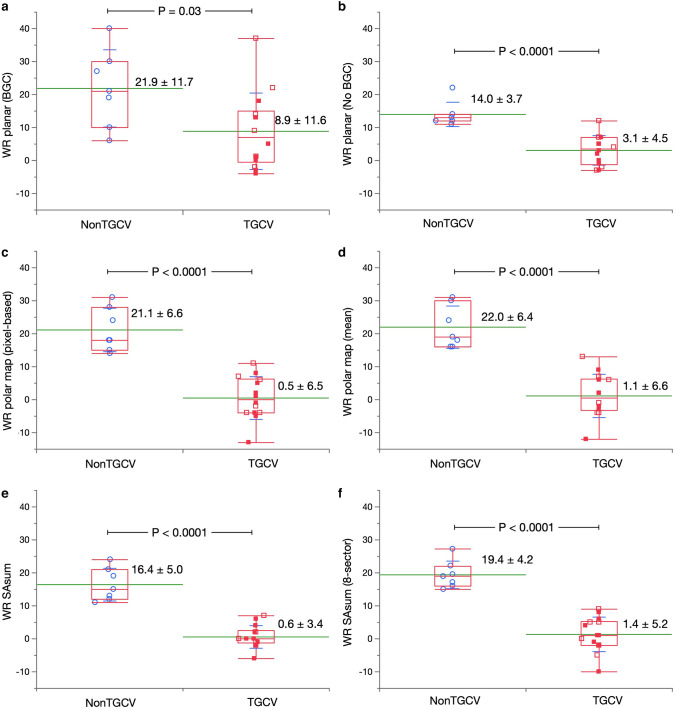
Fig. 4.
Washout rates (%) based on SPECT images from patients with and without TGCV. a–f, Methods PLb, PLn, PMpx, PMave, Ssum, and Ssec, respectively. Blue circle, red open and solid squares, respectively indicate non-TGCV, TGCV with and without extensive metabolic defects due to coronary artery diseases. The box plot denotes median and first and third quartiles and whiskers for value ranges. BGC, background correction; HRVS, Heart Risk View-S; SA, short-axis; seg, segment; TGCV, triglyceride deposit cardiomyovasculopathy; WR, washout rate

