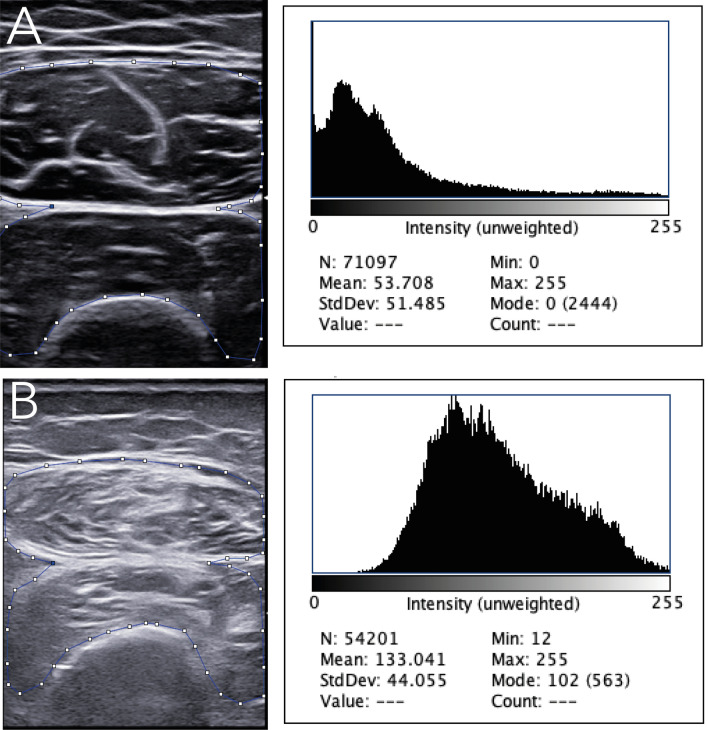
Fig. 2.
Muscle echogenicity in grayscale and histographic analysis in a healthy subject (a) compared to a patient with systemic sclerosis (b). An ultrasound transverse scan image of the rectus femoris (rf) and vastus intermedius (vi) showing increased muscle echogenicity in the patient with systemic sclerosis in comparison with the healthy subject (i.e., grade III of the Heckmatt scale, marked increased muscle echo with reduced bone echo vs grade I of the Heckmatt scale, normal hypoechoic muscle) [76]. The small squares and lines indicate the region of interest for grayscale image analysis with histograms

