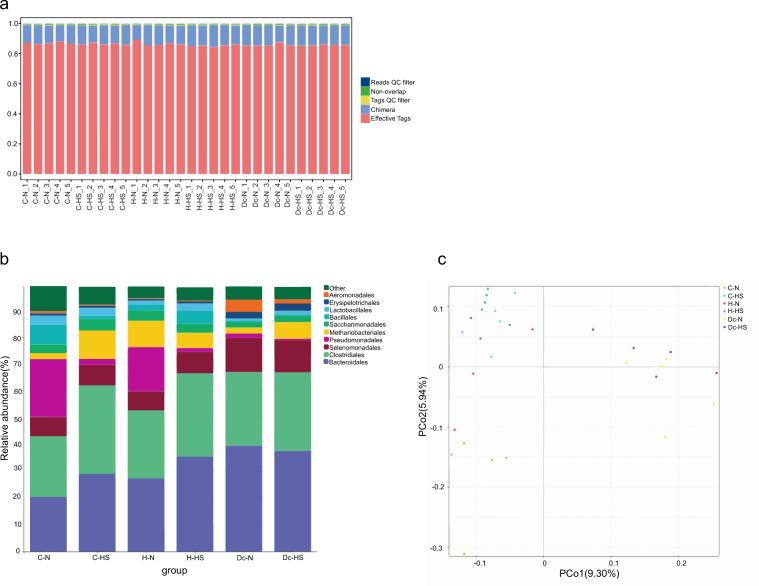
Fig. 1.
The quality assessment of 16S rDNA sequencing data. (a) Bar graph of sequencing data volume and filtering analysis effects. Reads QC filter: low-quality reads; Non-overlap: unassembled reads without overlap; Tag QC filter: tags that do not pass the “tag filter”; Chimera: number of chimera tags. (b) Bacterial community composition at the order level in this study. Taxonomic assignments of the 10 most abundant taxa are given. (c) Principal Coordinate Analysis (PCoA) of all datasets based on beta-diversity with unweighted-unifrac.

