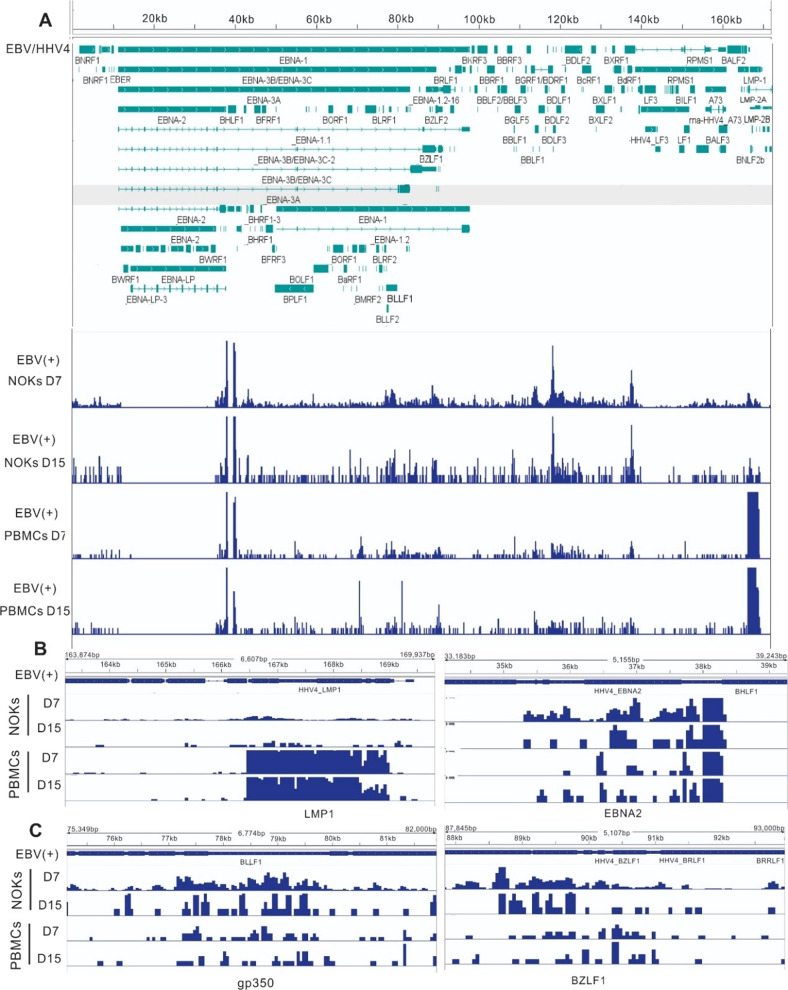
Fig. 2. Representative images of sequencing read mapped to EBV-encoded lytic and latent genes in EBV-infected PBMCs and NOKs.
EBV RNA expression in NOKs compared to that observed in PBMCs. A RNA-seq data for infected NOKs and infected PBMCs at different days mapped to the wild-type EBV genome. Genes corresponding to observed signals are indicated below the tracks. The RNA-seq data image shows that most EBV genes were differentially expressed in NOKs and PBMCs. B Zoom in of regions, EBV latent gene LMP1 and EBNA2 from RNA sequencing data shows more detail peaks. C Zoom in of regions, EBV lytic gene gp350 and BZLF1 from RNA sequencing data shows more detail peaks.

