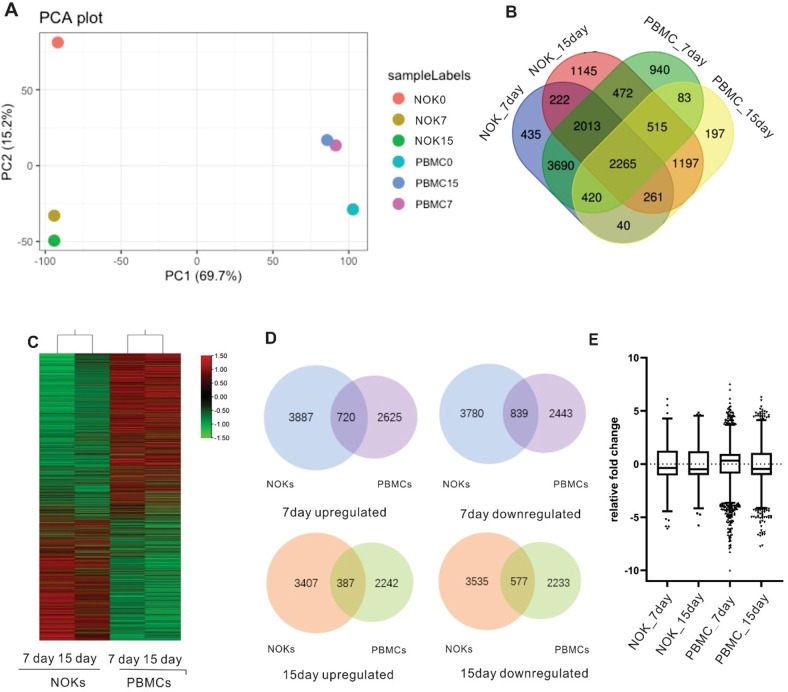
Fig. 3. EBV infection leads to distinctly different patterns of gene expression in NOKs and PBMCs.
Principal Component Analysis based on RNA-Seq analysis of NOKs and PBMCs. Host genes are differentially expressed between NOKs and PBMCs. A Relationship between the samples based on cellular gene expression using the Principal Component Analysis. The gene expression values are normalized to the whole dataset. B Cross analysis Venn diagrams of the results using combination of the infected NOKs and PBMCs. Venn diagram showing the total number of gene expressed in different samples. The number of genes differentially expressed in NOKs and PBMCs. The Venn diagram was created using draw Venn diagram. C Hierarchical clustering (shown as a heatmap) of differentially expressed genes between NOK infected cells and PBMC infected cells. Red and green colours represent relative high and low log2 gene expression values, respectively. D Venn diagrams comparing the numbers of genes observed to be up-regulated or down-regulated by EBV infection in NOKs (adjusted P < 0.01) compared with PBMCs (adjusted P < 0.01) at day7 and day15. E Identify infected NOKs and PBMCs with different temporal profiles. The box plot shows the fold change in expression of the main genes per time point.

