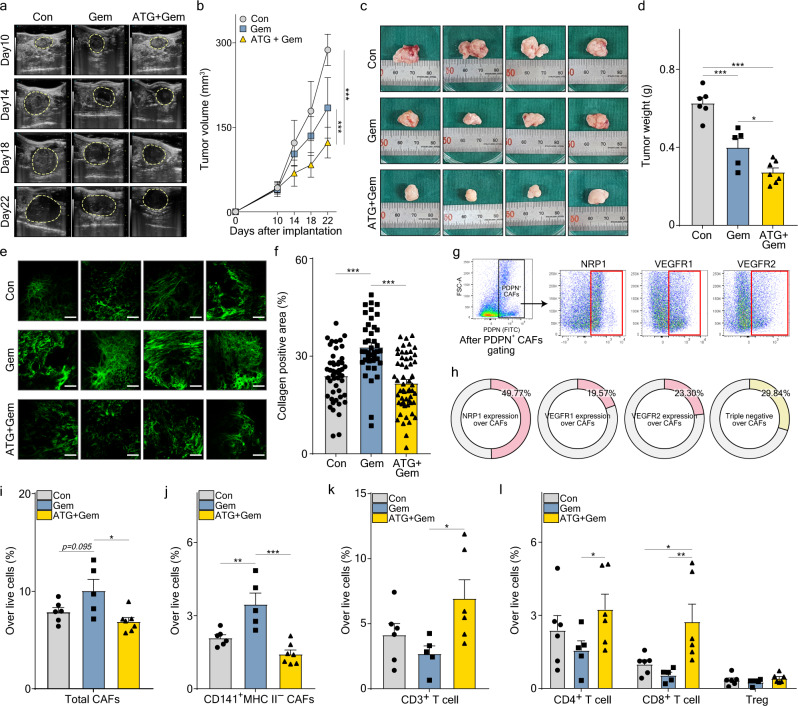
Fig. 8. Ate-Grab showed comparable therapeutic efficacy between KRAS-mutated murine PDAC and KRAS-wild type murine PDAC.
a Representative ultrasonographic images for orthotopic KPC tumor growth in vivo. Con, control; Gem, gemcitabine; ATG + Gem, Ate-Grab and gemcitabine cotreatment. b Tumor volumes compared across indicated treatment groups (Con, n = 6; Gem, n = 5; ATG + Gem, n = 7). ***P < 0.001; two-way ANOVA with Tukey’s multiple comparisons. c Representative images of KPC tumors. Ruler scale, 1 mm. d Tumor weights compared across indicated treatment groups (Con, n = 6; Gem, n = 5; ATG + Gem, n = 7). Data are presented as the mean ± SEM. *P < 0.05 (P = 0.030), ***P < 0.001, one-way ANOVA with Tukey’s multiple comparisons. e Representative SHG images of KPC tumors from each treatment group. Scale bars, 100 μm. f Average percentages of collagen+ area out of total area in tumors. Data from randomly selected fields of view were analyzed (Con, n = 48; Gem, n = 40; ATG + Gem, n = 56). Data are presented as the mean ± SEM. ***P < 0.001, one-way ANOVA with Tukey’s multiple comparisons. g Flow cytometry gating strategy to evaluate VEGF-related receptor expression in KPC tumor-infiltrated CAFs. Cells gated in red box were considered positive for the indicated receptors. Gating panel corresponds to FACS data in Fig. 8h. h Average percentages of NRP1-, VEGFR1-, or VEGFR2-expressing cells and triple negative cells for these receptors. Average percentages of i total CAFs (Gem vs ATG + Gem: P = 0.011) and j CD141+ MHC II− CAFs (Con vs Gem: P = 0.006) in the KPC tumor microenvironment. Data from six mice from the control group, five mice from the gemcitabine group, and seven mice from the Ate-Grab+gemcitabine group were analyzed. Data are presented as the mean ± SEM. *P < 0.05, **P < 0.01, ***P < 0.001, one-way ANOVA with Tukey’s multiple comparisons. Average percentages of k CD3+ T cells (Gem vs ATG + Gem: P = 0.039), l CD4+ T cells, CD8+ T cells and Tregs in the KPC tumor microenvironment of each treatment group (Con, n = 6; Gem, n = 5; ATG + Gem, n = 6). Data are presented as the mean ± SEM. *P < 0.05 (Gem vs ATG + Gem in CD4+ T cells: P = 0.023, Con vs ATG + Gem in CD8+ T cells: P = 0.013), **P < 0.01 (Gem vs ATG + Gem in CD8+ T cells: P = 0.002), two-way ANOVA with Tukey’s multiple comparisons. Source data are provided as a Source Data file.

