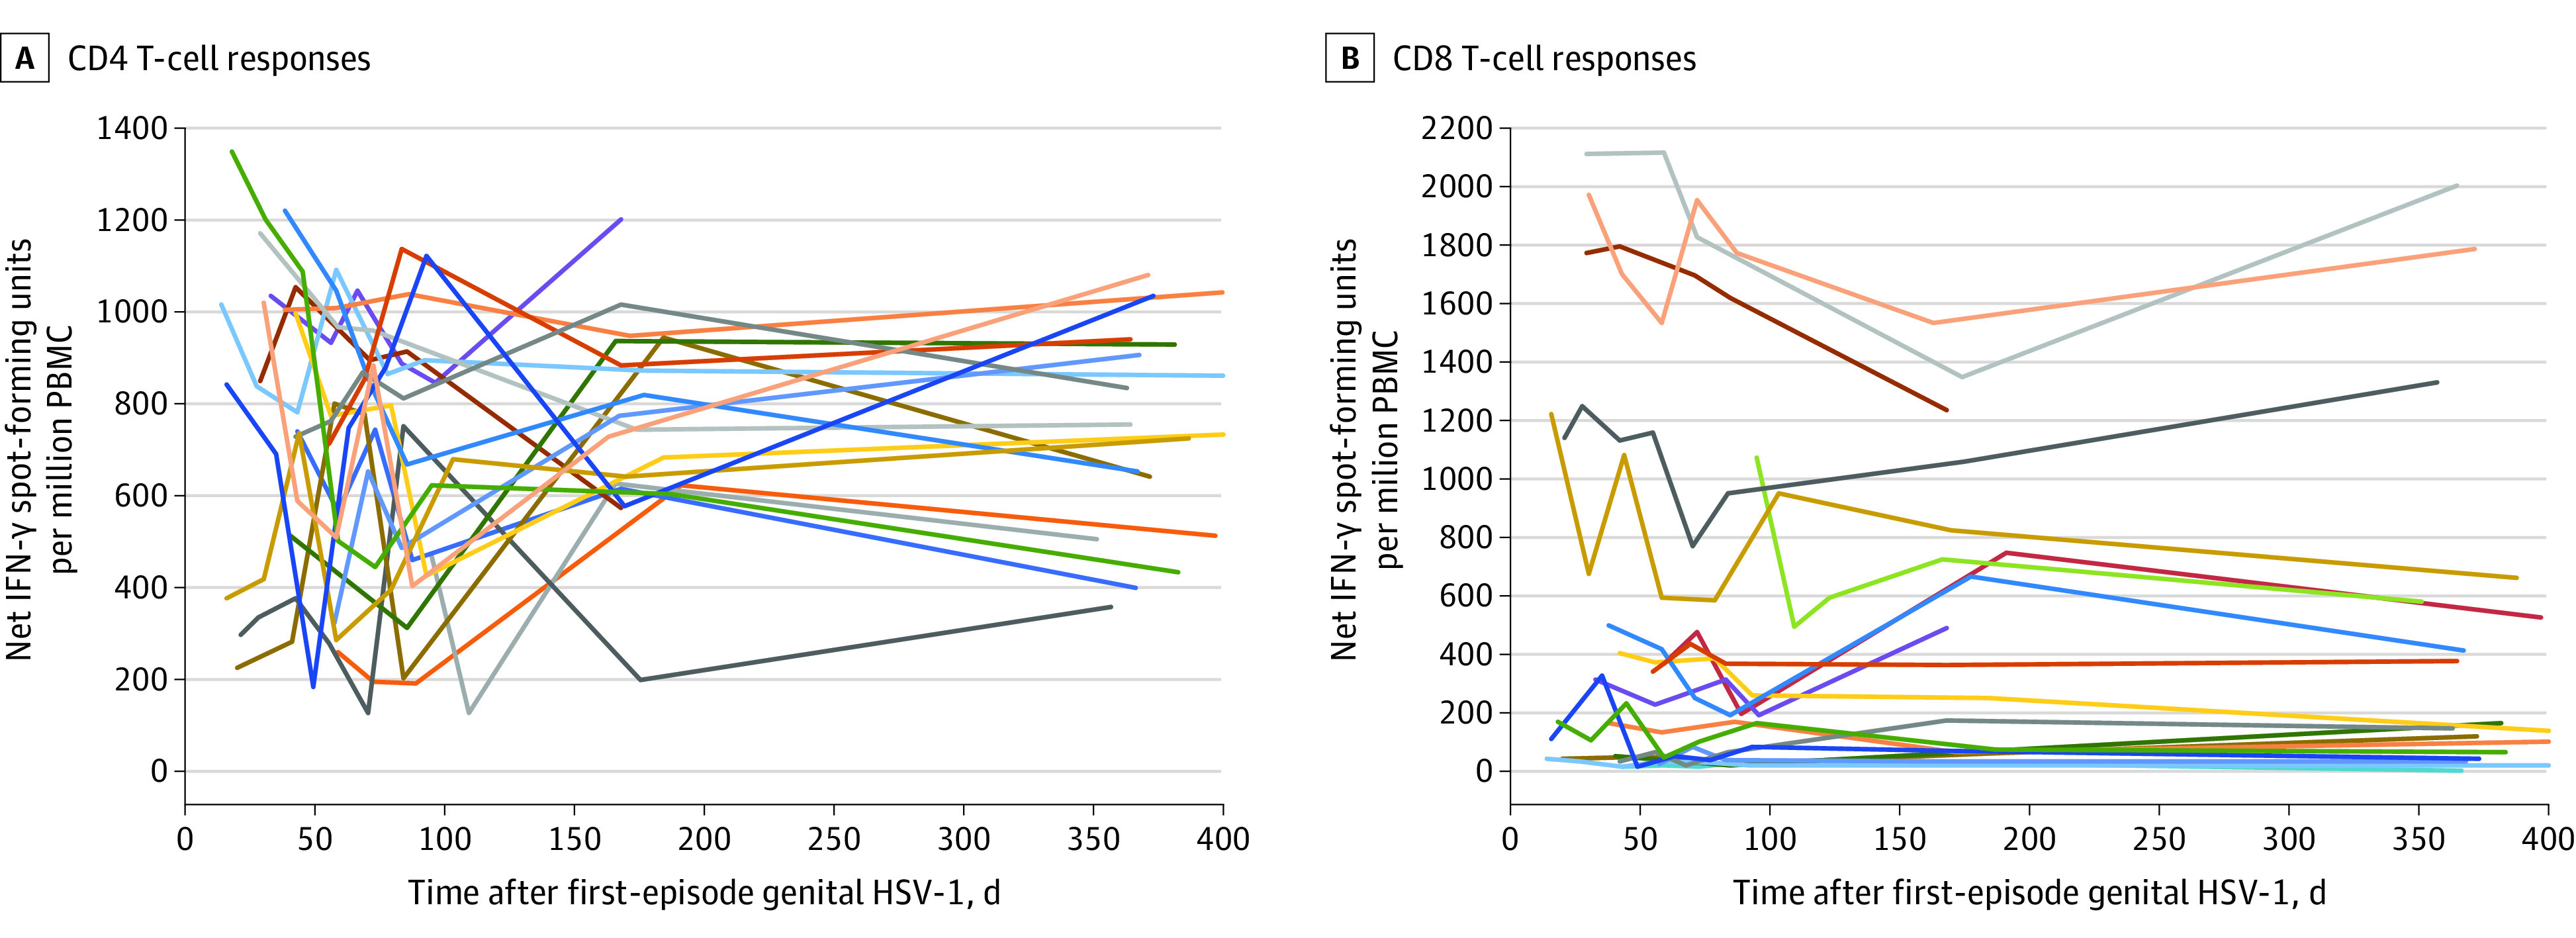
Figure 3. Cellular Immune Responses Measured Over Time for the First 20 Participants With Primary Genital Herpes Simplex Virus Type 1 (HSV-1).

Each line represents the time course for a single participant, and participants are represented by the same line color for both graphs. IFN indicates interferon; PBMC, peripheral blood mononuclear cells.
