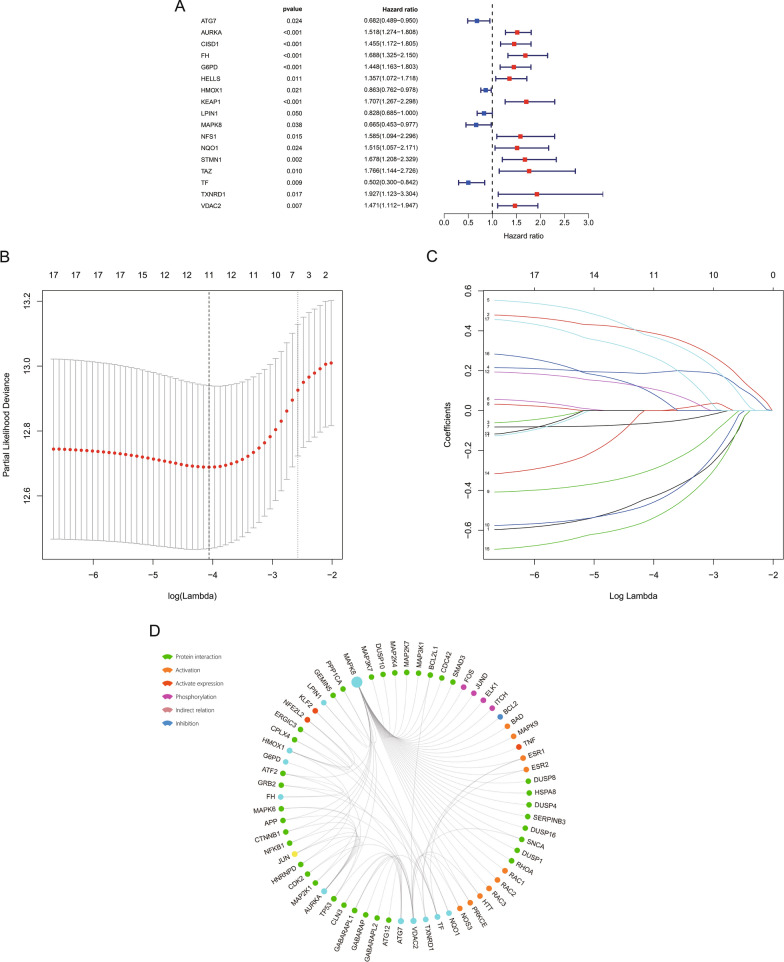
Fig. 1.
Development of the prognostic model based on FRGs in the training cohort. A A forest plot showing the FRGs associated with OS according to univariable cox analysis. B Variable selection by lasso regression analysis with 1000 bootstrap replicates. C LASSO coefficients of FRGs. D The protein–protein interactions among the model related proteins and the other proteins. Green, protein interaction; orange, activation; red, activate expression; purple, phosphorylation; grey pink, indirect relation; blue, inhibition. The circle size represents the number of interacting proteins that are linked to a specific protein (the bigger the circle size, the more interacted proteins)

