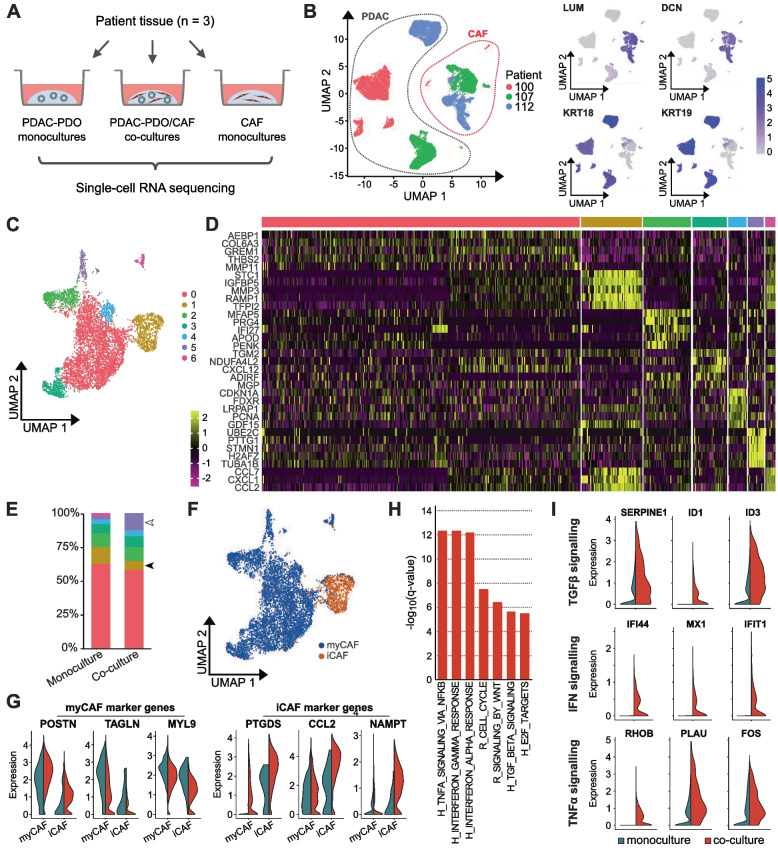
Fig. 3.
Inflammatory pathways are upregulated in CAFs after co-culture with PDAC organoids. A Overview of the samples used for single-cell RNA sequencing. B UMAP representation of all single-cell transcriptomes. Dotted lines indicate CAF and PDAC cells, which were distinguished by the expression of known marker genes. LUM and DCN expression identifies CAFs, while KRT18 and KRT19 expression identifies PDAC tumor cells. C Integrated UMAP representation of CAFs from monoculture and co-culture samples, with seven clusters distinguished by Louvain clustering. D Single-cell expression of the top five enriched genes for each CAF cluster in (C). E Distribution of CAFs among the seven clusters, colored as in (C), in monoculture and co-culture samples. The proportion of cells in cluster 1, with an immune response signature, is decreased in co-cultures (filled arrowhead); the proportion of cells in cluster 5, expressing cell cycle related genes, is increased in co-cultures (unfilled arrowhead). F Distribution of iCAF-like and myCAF-like cells, as identified by principal component analysis (Methods and Supplementary Fig. S2D), shown on the same UMAP as in (C). G Expression of iCAF and myCAF marker genes in the iCAF-like and myCAF-like populations identified in (F), comparing monocultures (blue) to co-cultures (red). H Selected Hallmark (H) and Reactome (R) pathways upregulated in CAFs in co-cultures compared to monocultures. I Expression of genes involved in TGFβ, IFN and TNFα signaling in CAFs in monocultures (blue) and co-cultures (red) showing increased expression of genes in co-culture conditions

