Fig. 6.
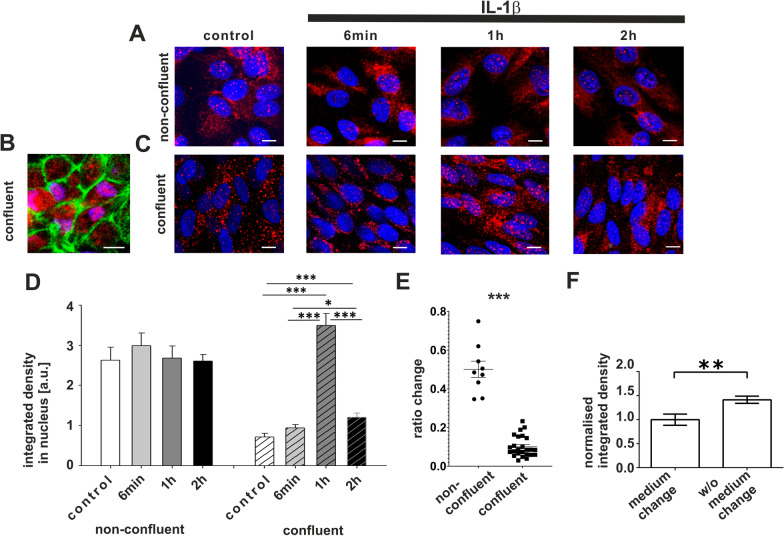
IL-1β treatment of ARPE-19 cells results in FoxP3 translocation from the cytosol to the nucleus. A Constitutive FoxP3-expression (red) in non-confluent ARPE-19 cells (blue = DAPI staining of the nucleus) at different time points after IL-1β (100 ng/ml) application: before, 6 min, 1 h and 2 h after IL-1β addition to the culture medium. Scale bar represents 10 µm. B Constitutive FoxP3-expression (red) in confluent iPS-RPE cells with a transepithelial resistance of 600 Ωcm2 (blue = DAPI staining of the nucleus, green = phalloidin to mark the cell borders). Scale bar represents 10 µm. C FoxP3 (red) in confluent ARPE-19 cells (blue = DAPI staining of the nucleus), same treatment as in A). Scale bar represents 10 µm. D Quantification of FoxP3 in the nucleus by determining the integrated density of the red pixels inside the nucleus (DAPI-stained area) and comparing different time points for non-confluent and confluent ARPE-19 cells. All numbers are given as means + SEM in arbitrary unit (a.u.), Student’s t-test, *p < 0.05; ***p < 0.001, N = 21–53). E IL-1β-evoked rises in intracellular free Ca2+. Ca2+-transients were measured using the Ca2+-sensitive dye fura-2 at the peak of the Ca2+ rise and plotted as changes in the ratio of the fluorescence of the two excitation wavelengths 340 and 380 nm: left group represents the non-confluent and right group the confluent cells (means ± SEM, ***p < 0.001; Mann–Whitney U test). F comparison of FoxP3 protein in confluent ARPE-19 cells that have been maintained under standard conditions and those that were kept for 14 days without changing the culture medium as stressor (quantification analogous to Fig. 6D by measuring integrated density of red pixels in the nucleus data are normalized to cells with medium change (standard conditions); means + SEM, Student’s t test, p values **p < 0.01, N = 20)

