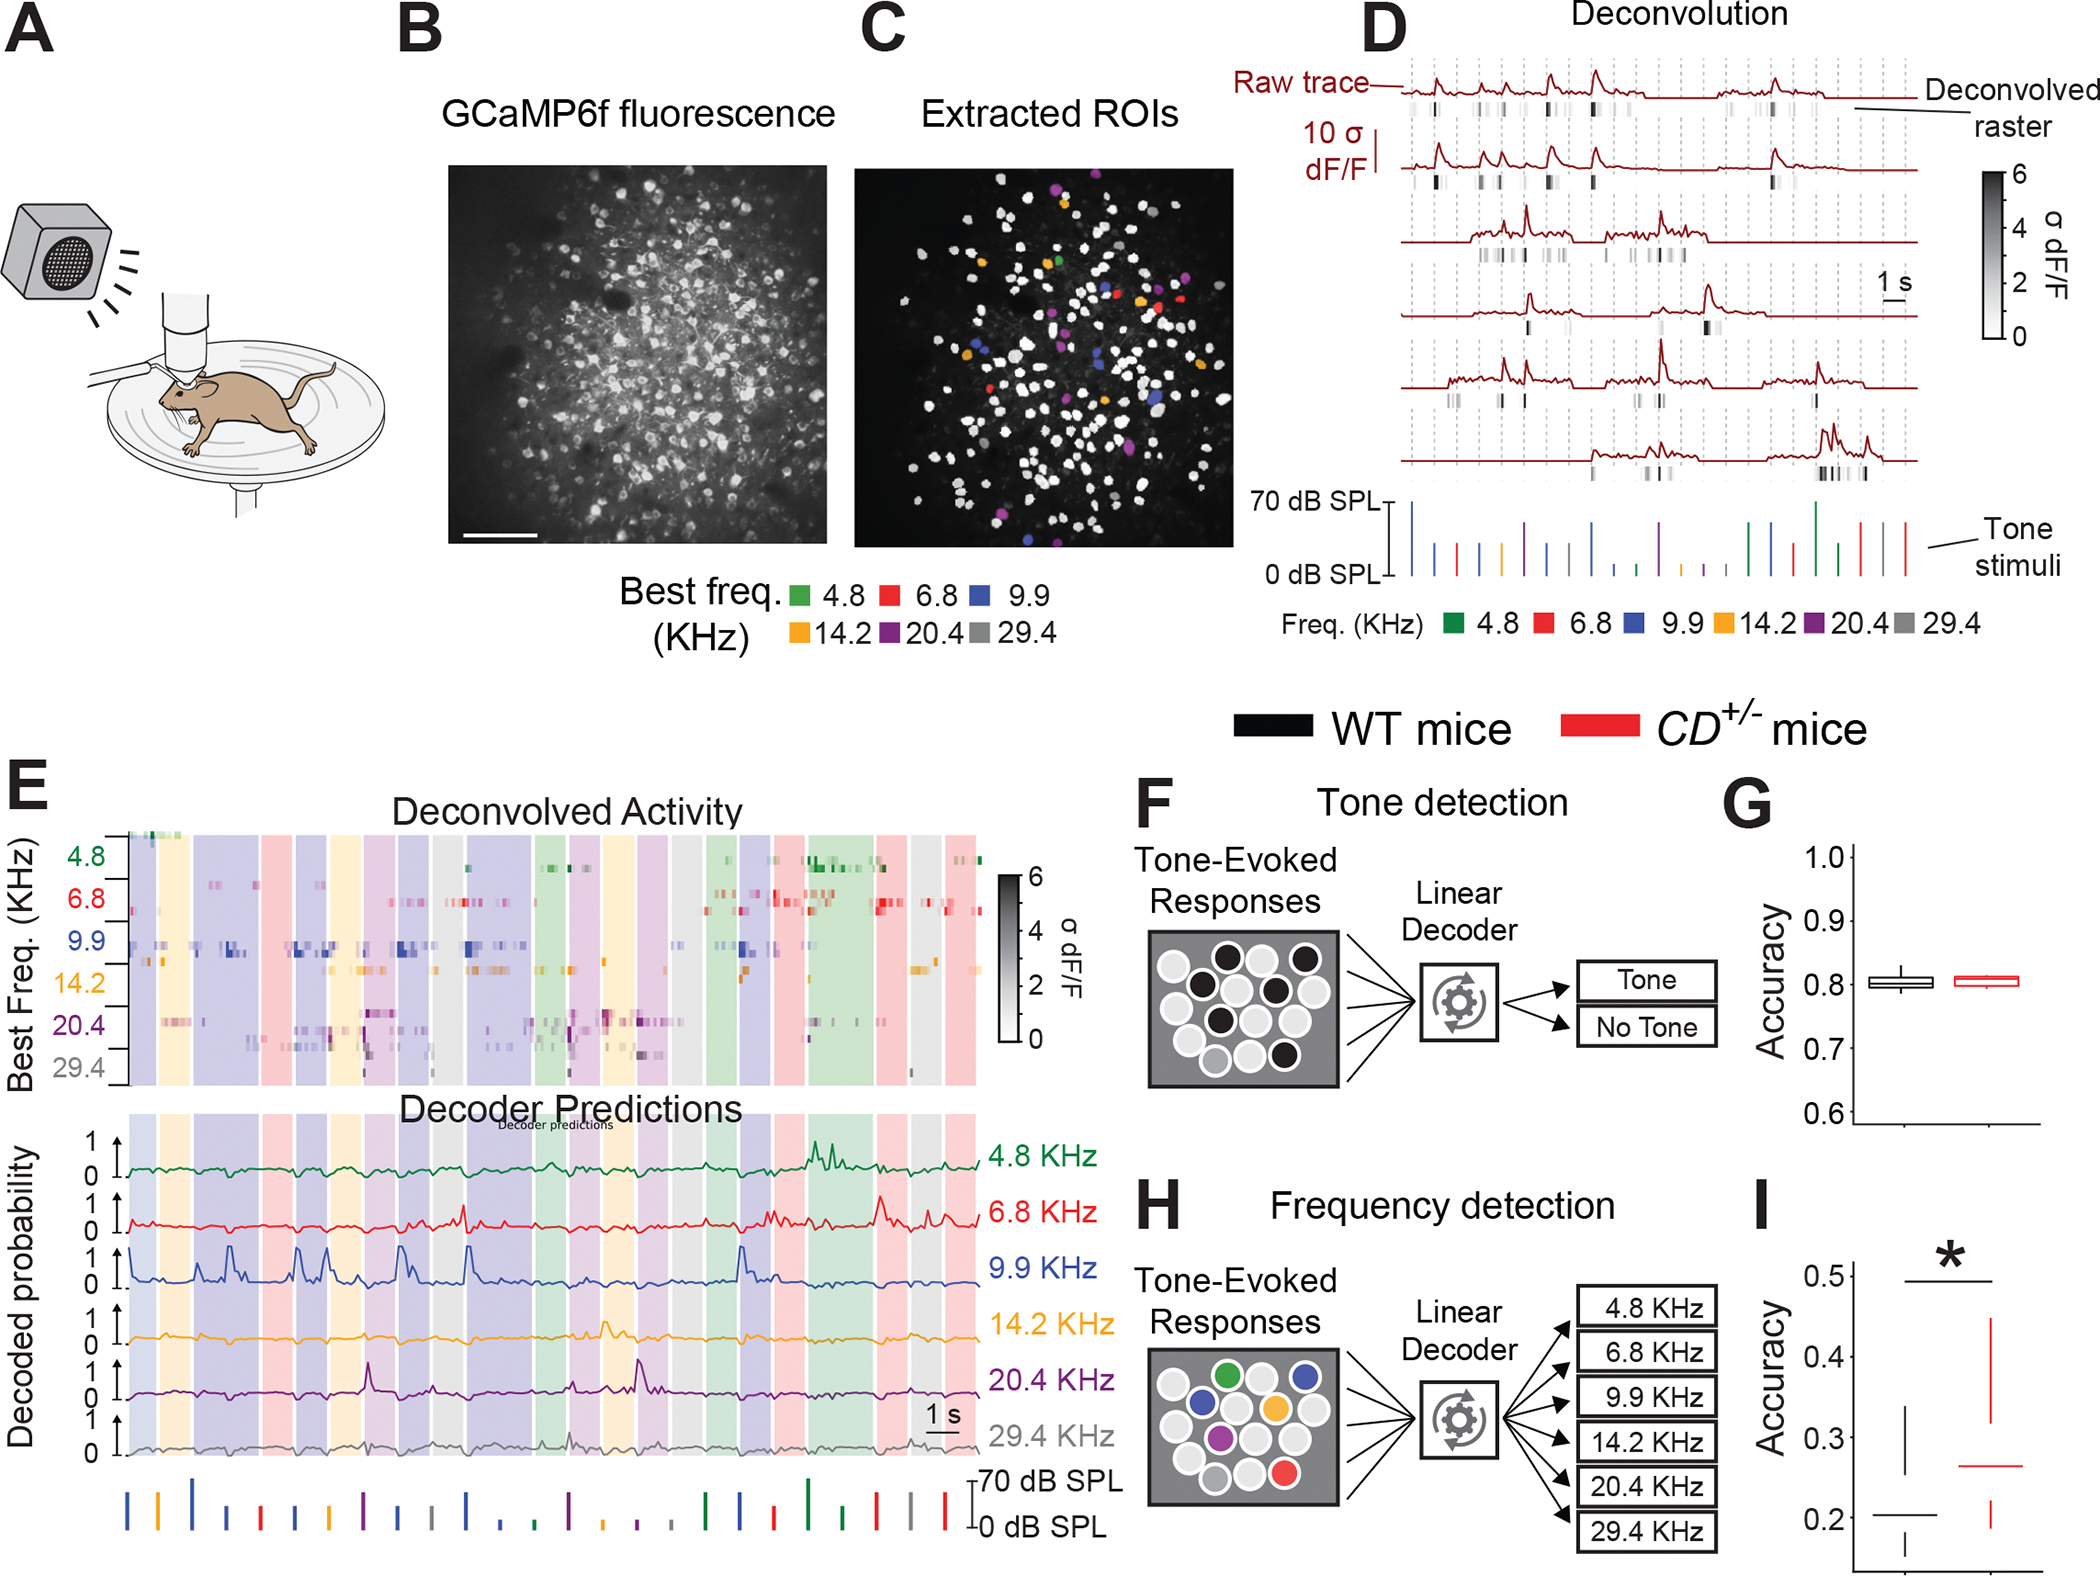
Figure 3: Improved frequency coding by the ACx in awake WBS mice.

A. Scheme showing two-photon Ca2+ imaging and sound delivery to an awake, head-fixed mouse on a running wheel.
B, C. (B) Images of L4 excitatory cells responding to sound with changes in GCaMP6f fluorescence in the ACx. (C) Segmented ROIs representing individual excitatory neurons. Neurons are color-coded for their best frequency. Noncolored neurons indicate spontaneously active cells that did not respond to sound cues.
D. GCaMP6f fluorescence responses to pure tones (brown, “Raw trace,” top) that are processed to produce temporally discrete raster plots (gray/black, “Deconvolved raster,” bottom). Pure tone stimuli are shown below. Frequency is indicated by color, and intensity is indicated by height. Times of tone delivery are indicted by dotted vertical lines.
E. (Top) Responses of 25 cells after tone stimuli and decoder predictions. Stimuli are shown below. Each deconvolved activity row is a raster representing 1 cell. Cells are sorted by best frequency, as indicated by the raster color and frequency label at the left. Response intensity is indicated by color saturation, as shown in the scale bar (right). Vertical shading indicates the frequency last presented. (Bottom) Each decoder prediction row indicates the predicted probability of one frequency tone (indicated by line color and label at right) having been presented.
F. Scheme of the decoder, which pools responses from all imaged neurons to predict whether any tone was presented.
G. Equal accuracy of the tone-detection decoder was based on the activity of neurons in WT (n=30) and CD+/− (n=6) mice.
H. Scheme of decoder, which pools responses from all imaged neurons to predict which frequency of tone was presented.
I. Frequency detection is more accurate based on the activity of CD+/− (n=6 mice) vs WT (n=30 mice) neurons. Rank sum test *P = 0.034.
Data are presented as interquartile ranges (quantiles 5-25-50-75-95).
