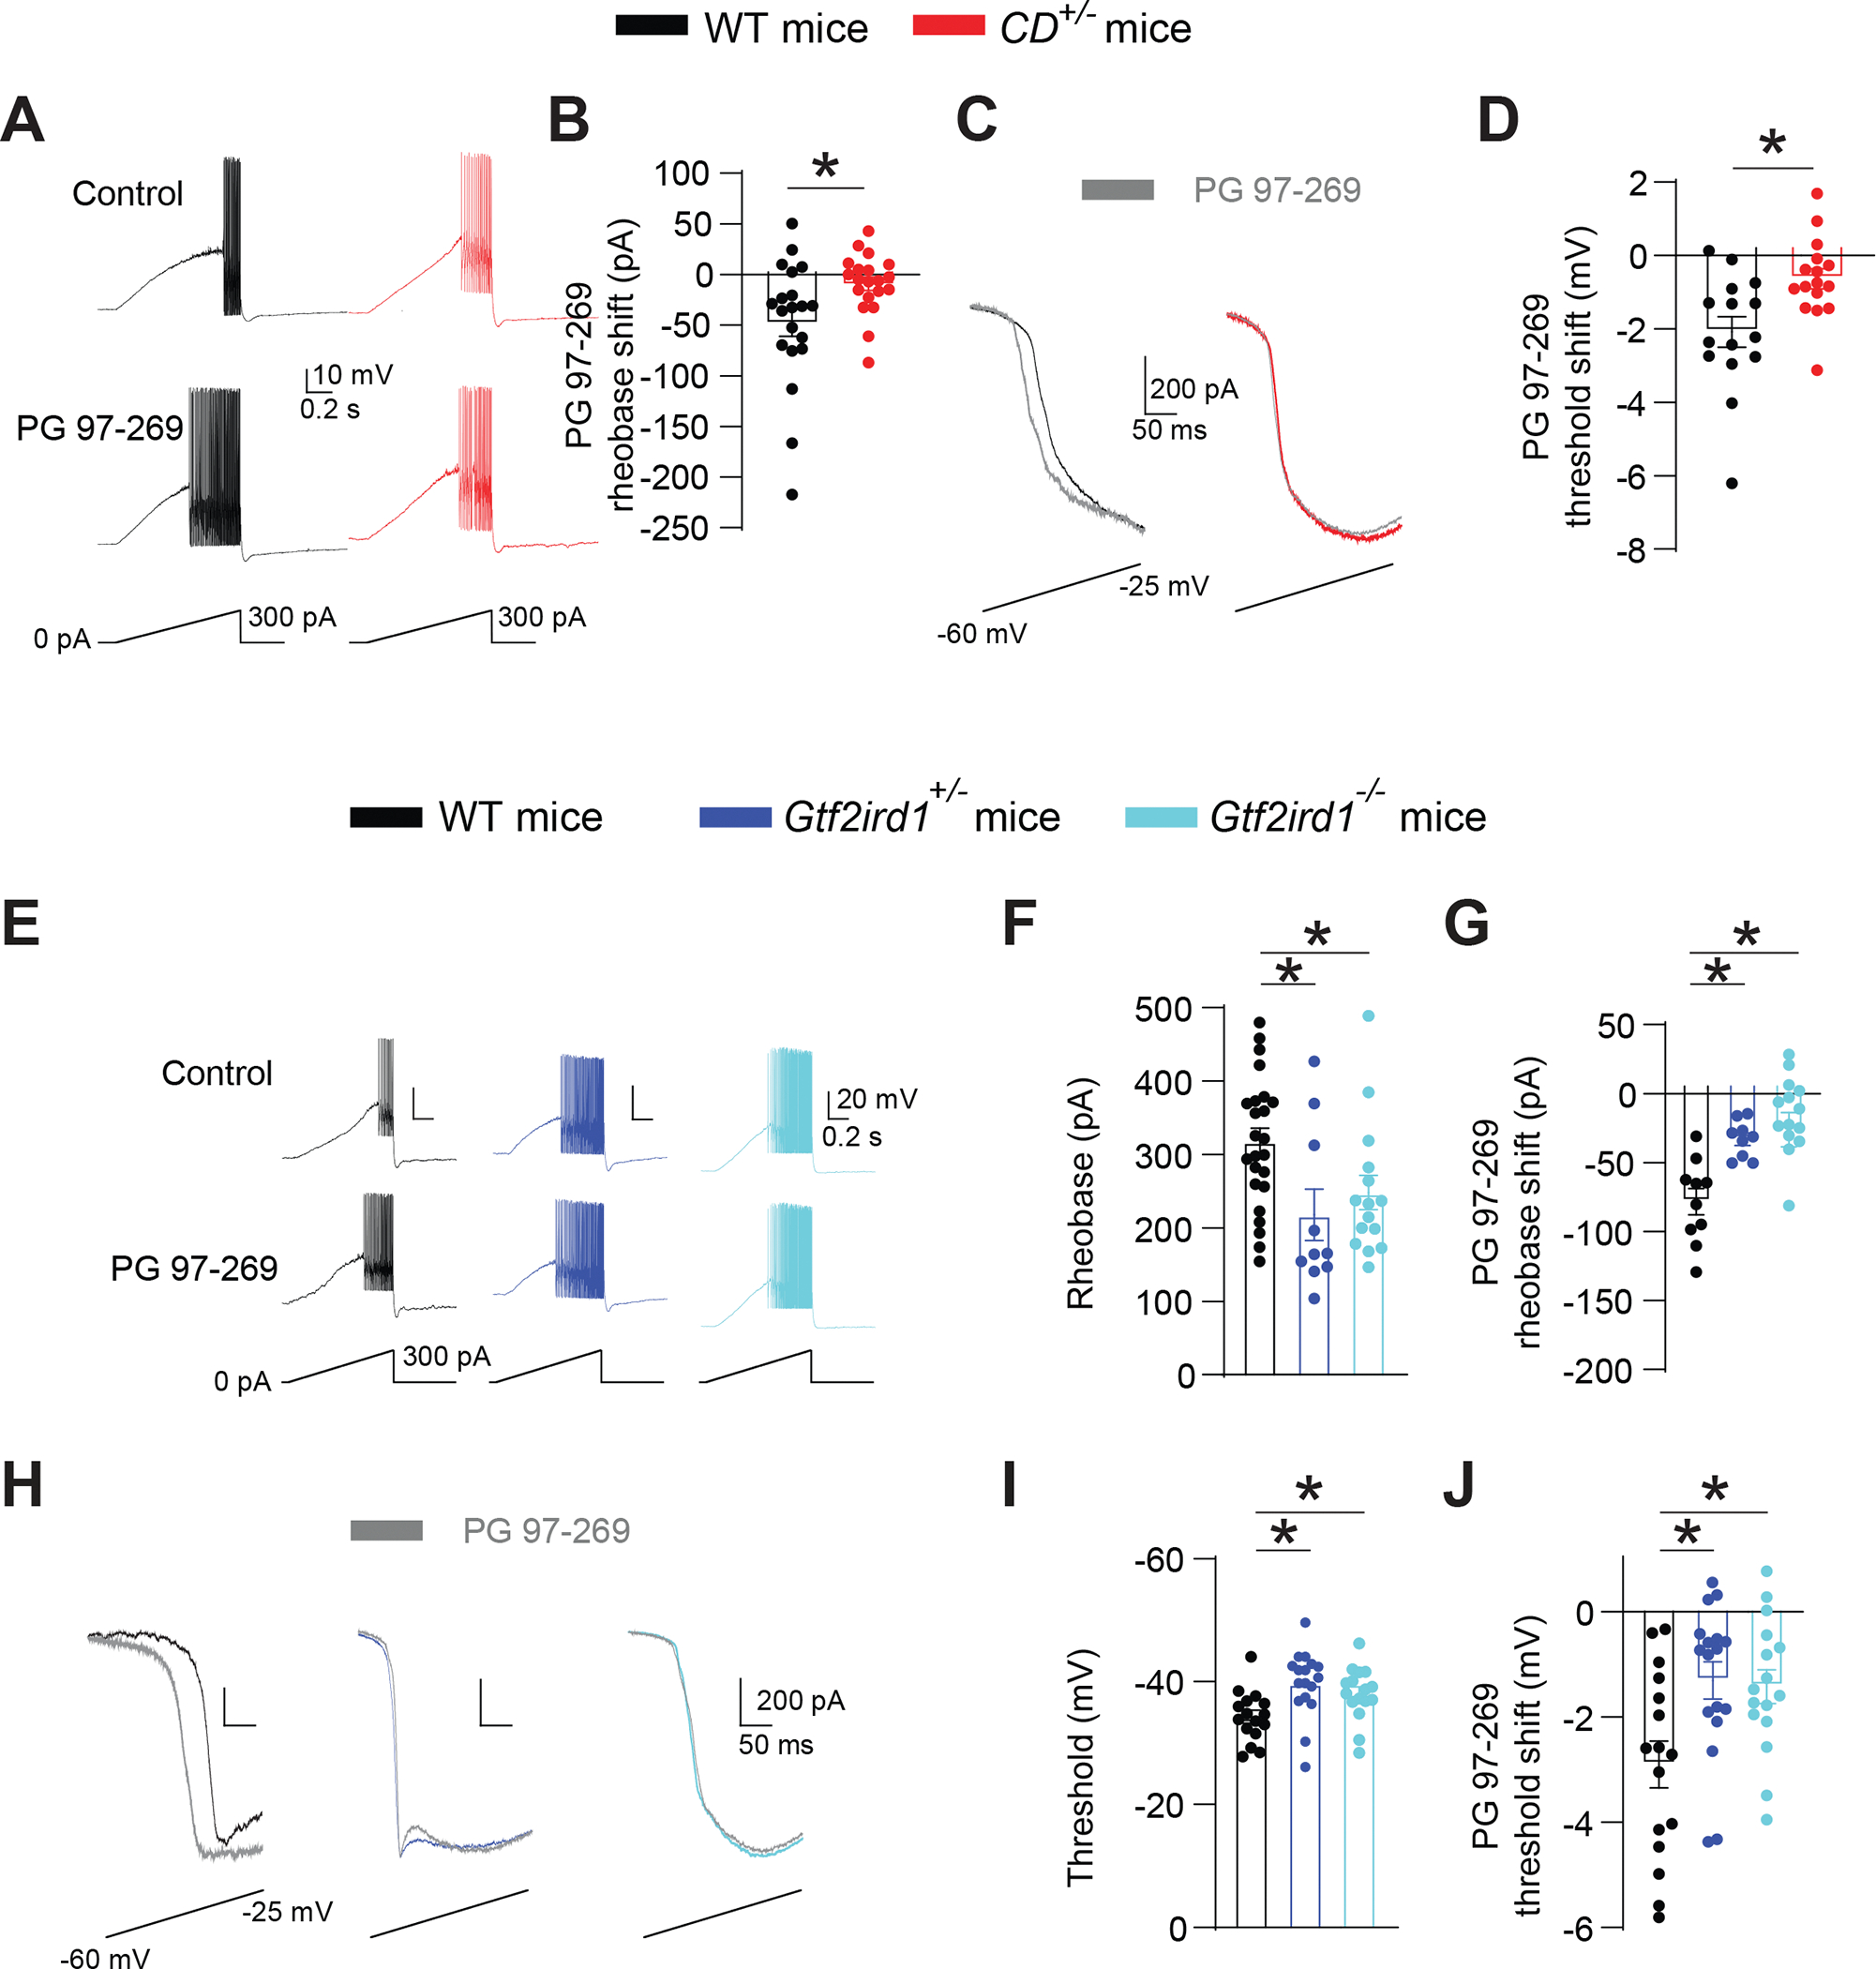
Figure 6: Pharmacologic block of VIPR1 causes FS interneuron hyperexcitability and lowers the threshold for inward voltage-gated current.

A, B. The VIPR1-specific antagonist PG 97–269 elevates excitability in WT but not in CD+/− FS interneurons in the ACx. (A) Traces of voltage responses to a current ramp before and after local application of PG 97–269 in WT and CD+/− FS interneurons. (B) PG 97–269 lowers the rheobase in WT (n=20; paired t-test, *P = 0.003) but not in CD+/− (n=20) cells. WT vs CD+/−, rank sum test, *P = 0.018.
(C) Traces of current response to a voltage ramp.
(D) PG 97–269 causes a larger threshold shift in inward voltage-gated current in WT (n=15) vs CD+/− (n=16) interneurons. Unpaired t-test, *P = 0.006.
E-G. Gtf2ird1-deficient ACx FS interneurons are hyperexcitable, and PG 97–269 has a diminished effect on their excitability. (E) Traces showing voltage and AP responses to current ramps in WT, Gtf2ird1+/−, and Gtf2ird1−/− FS interneurons, before and after local application of PG 97–269. (F) Ramp rheobase is lower in Gtf2ird1+/− (n=10) and Gtf2ird1−/− (n=15) interneurons than in WT (n=25) cells. One-way ANOVA: WT vs. Gtf2ird1+/− *P = 0.008; WT vs Gtf2ird1−/− *P = 0.022. (G) PG 97–269 has a weaker effect on rheobase in Gtf2ird1+/− (n=9) and Gtf2ird1−/− (n=14) FS interneurons than in WT (n=10) cells. One-way ANOVA: WT vs Gtf2ird1+/− *P = 0.021; WT vs Gtf2ird1−/− *P <0.001.
H-J. Threshold for the inward voltage-gated current is more hyperpolarized, less sensitive to PG 97–269 in FS cortical interneurons from Gtf2ird1-deficient mice. (H) Traces of current responses to voltage ramps in WT, Gtf2ird1+/−, and Gtf2ird1−/− interneurons, before and after local application of PG 97–269. (I) Inward current threshold is more hyperpolarized in Gtf2ird1+/− (n=17) and Gtf2ird1−/− (n=16) interneurons compared to WT (n=16) cells. One-way ANOVA: WT vs Gtf2ird1+/− *P = 0.005; WT vs Gtf2ird1−/− *P = 0.046.
(J) PG 97–269 has a weaker effect on inward voltage-gated current threshold in Gtf2ird1+/− (n=17) and Gtf2ird1−/− (n=16) interneurons than in WT (n=16) cells. One-way ANOVA: WT vs Gtf2ird1+/− *P = 0.012; WT vs Gtf2ird1−/− *P = 0.016.
Averaged data are presented as the mean ± SEM, with individual measurements overlaid as dots.
