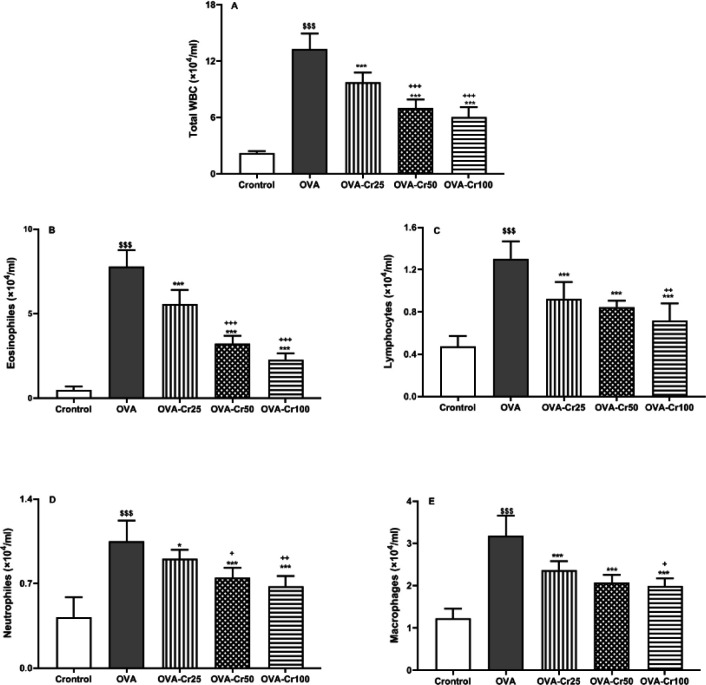
Figure 2.
Total WBC (A), eosinophil (B), lymphocyte (C), neutrophil (D), and macrophage (E) counts in the BALF of the control, asthmatic (OVA), OVA- crocin 25 mg/kg (OVA-Cr25), OVA- crocin 50 mg/kg (OVA-Cr50), and OVA-crocin 100 mg/kg (OVA-Cr100) groups. Data are shown as mean±SEM. $$$: P<0.001 control vs OVA group. *: P<0.05 and ***: P<0.001 OVA group vs crocin treated groups. +: P<0.05, ++: P<0.01, and +++: P<0.001 OVA-Cr25 group vs OVA-Cr50 and OVA-Cr100 groups. &&: P<0.01 OVA-Cr50 group vs OVA-Cr100 group. For each group, n = 6. Comparisons between groups were made using the ANOVA test
WBC: white blood cell; BALF: Bronchoalveolar lavage fluid

