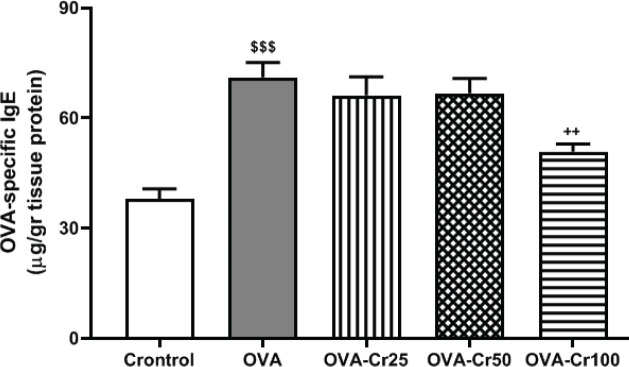
Figure 5.
Lug tissue protein levels of OVA-specific IgE. Values are expressed as mean+SEM. Abbreviations are the same as Figure 2. $$$: P<0.001 control vs OVA group. ++: P<0.01 OVA group vs crocin-treated groups. For each group, n=6. Comparisons between groups were made using the ANOVA test
OVA: Ovalbumin

