
Figure 3.
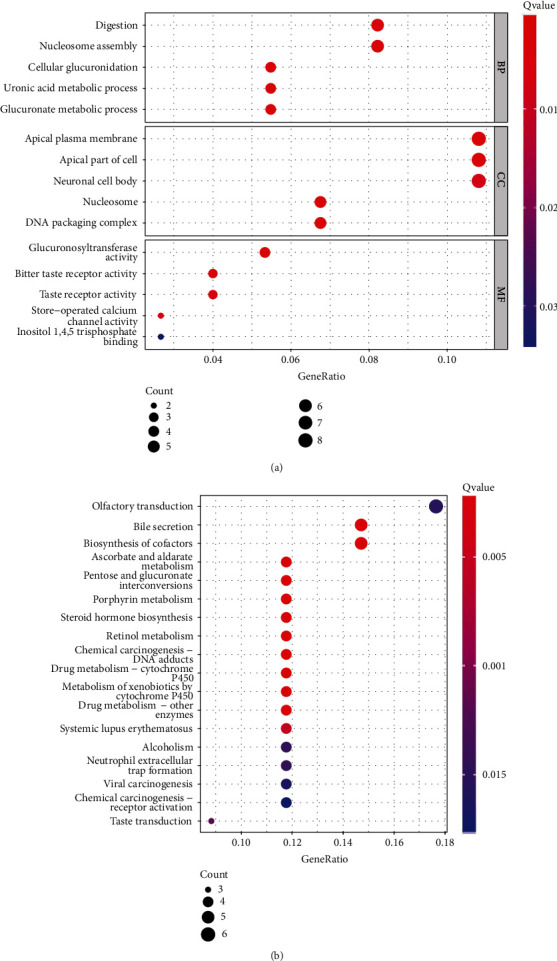
Functional enrichment analysis of DEGs between the high-NPSR1-AS1-expression group and low-NPSR1-AS1-expression group. (a) Significantly enriched GO terms of DEGs. (b) Significant KEGG pathway terms of DEGs.
Official websites use .gov
A
.gov website belongs to an official
government organization in the United States.
Secure .gov websites use HTTPS
A lock (
) or https:// means you've safely
connected to the .gov website. Share sensitive
information only on official, secure websites.
Functional enrichment analysis of DEGs between the high-NPSR1-AS1-expression group and low-NPSR1-AS1-expression group. (a) Significantly enriched GO terms of DEGs. (b) Significant KEGG pathway terms of DEGs.