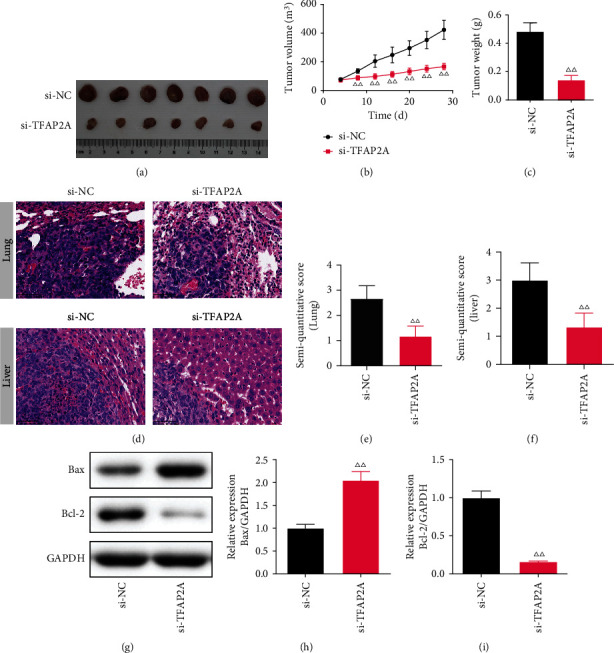
Figure 7.

The effect of TFAP2A-silencing on pancreatic cancer. () (a) The photographs of tumors dissected from PC mice. (n =7) (b) The tumor volume. (n =7) (c) The tumor weight. (n =7) (d-f) The semi-quantitative score and typical picture of Hematoxylin-eosin staining in the lung and liver. (×400, n =7) (g-i) The Bax and Bcl-2 protein levels in the lung of PC mice (n =3). ΔΔP<0.01 compared to the si-TFAP2A group.
