
Figure 8.
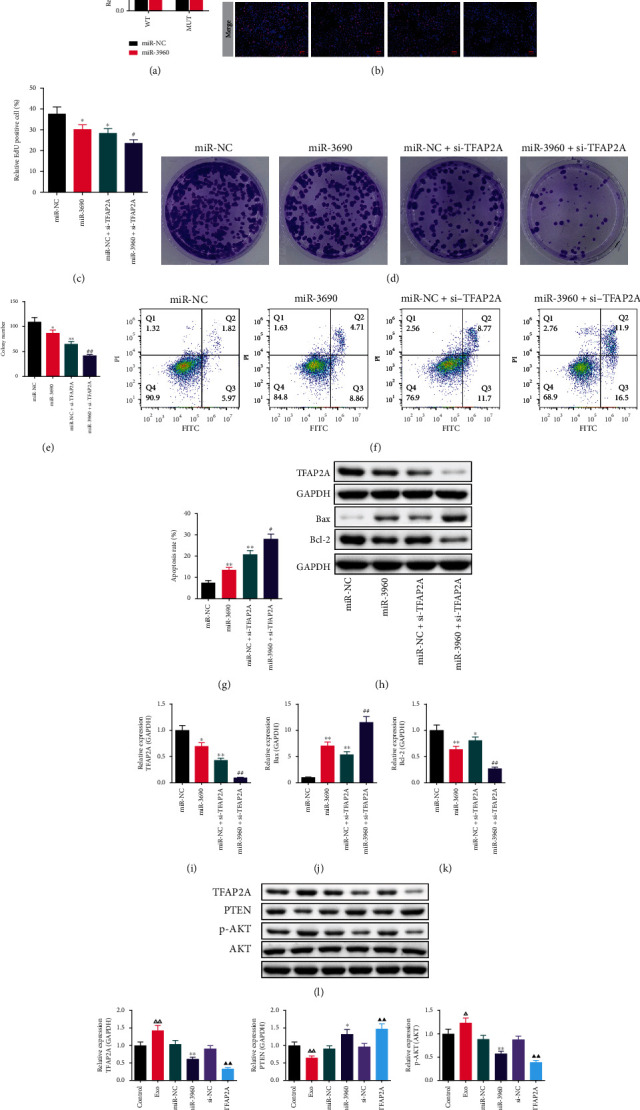
The effect of TFAP2A-knockdown on miR-3960-overexpressed PANC-1 cells and the expression of TFAP2A and PTEN/Akt signaling proteins in PANC-1 cells. (, n =3) (a) The dual-luciferase reporter assay. (b-c) The typical pictures and relative positive cells of EdU assay (n =3). Red indicates EdU positive cells and blue indicates DAPI positive cells. (×400) (d, e) The typical pictures and colonies number of cell colony formation assay. (f, g) The apoptosis of PANC-1 cells tested by Flow cytometry. (h-k) The TFAP2A, Bax and Bcl-2 protein levels in miR-3960-overexpressed PANC-1 cells. (l-o) The TFAP2A, PTEN, p-AKT/AKT protein levels. ∗P <0.05, ∗∗P <0.01 compared to the miR-NC group, ##P <0.01 compared to the miR-NC + si-TFAP2A group, ΔΔP<0.01 compared to the control group, ▲▲P <0.01 compared to the si-NC group.