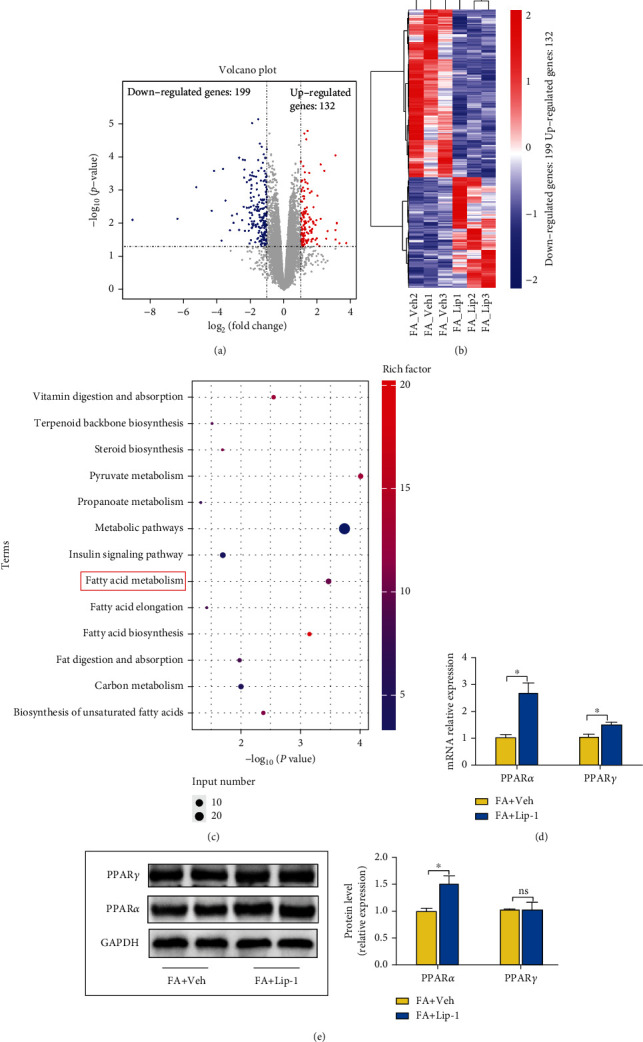
Figure 8.

Ferroptotic participation in NASH might be related to inhibition of PPARα. (a) Volcano plot showing the upregulated and downregulated genes in the Lip-1 treatment group. (b) Heatmap shows the DEGs between the FA+Veh and FA+Lip-1 groups; blue indicates low expression and red indicates high expression. (c) The DEGs between the FA+Veh and FA+Lip-1 groups were identified with the Kyoto Encyclopedia of Genes and Genomes (KEGG) pathway enrichment analysis. Rich factor (%) was the ratio of the number of DEGs annotated in a pathway (as indicated in the y-axis) to the number of all genes annotated in the pathway. (d) Hepatic mRNA levels for PPARα and PPARγ were measured by RT-qPCR, and GAPDH was used as a control. (e) PPARα and PPARγ protein levels in the FA+Veh and FA+Lip-1 groups were assessed by western blotting and GAPDH was used as a control. Data are presented as mean ± SEM. ∗P < 0.05; ns: not significant.
