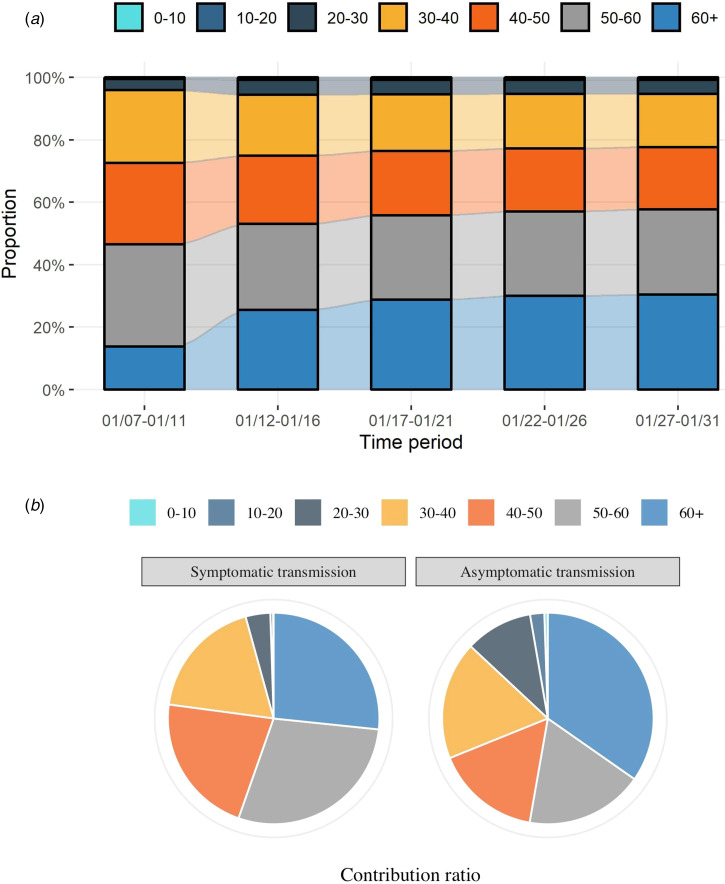
Fig. 5.
The burden of transmission caused by different ages. (a) The estimated (contribution) ratios of new transmissions from different ages over different time periods; (b) The estimated (contribution) ratios of symptomatic and asymptomatic transmission from different ages. The contribution ratio of each age group is calculated by the proportion of the transmissions caused by the corresponding age group to the number of all transmissions in each transmission type, from 8 January to 1 February 2020.

