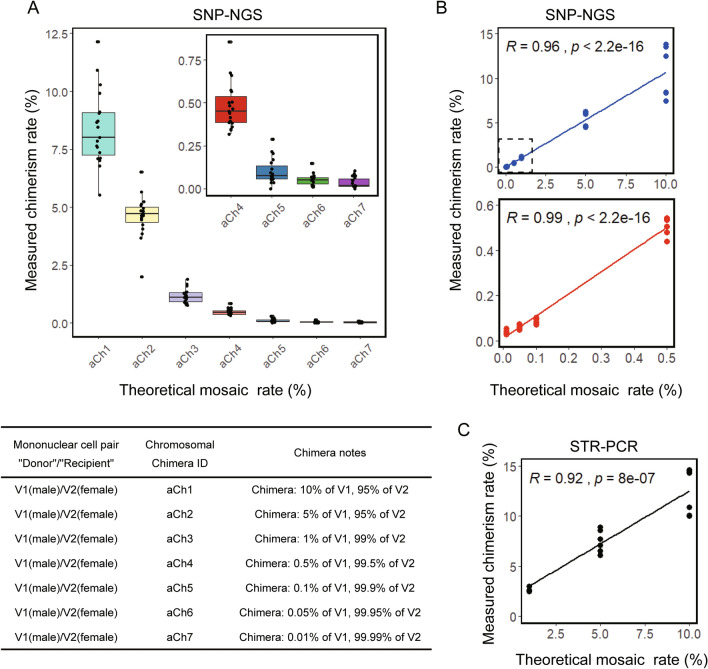
Fig. 1.
Comparison of the results obtained from chimerism quantification with SNP-NGS and STR-PCR. A Box plot of the results obtained by SNP-NGS. Jitter scattered points represent SNP sites. B Scatter plot of the results obtained by SNP-NGS. The upper panel shows six sets of data for the series of artificial chimerism (aCh1-aCh7: 10%, 5%, 1%, 0.5%, 0.1%), 0.05%, and 0.01%). The lower panel shows six sets of data for three artificial chimerism (aCh4-aCh7: 0.5%, 0.1%, 0.05% and 0.01%). C Scatter plot of the results obtained by multiple STR-PCR

