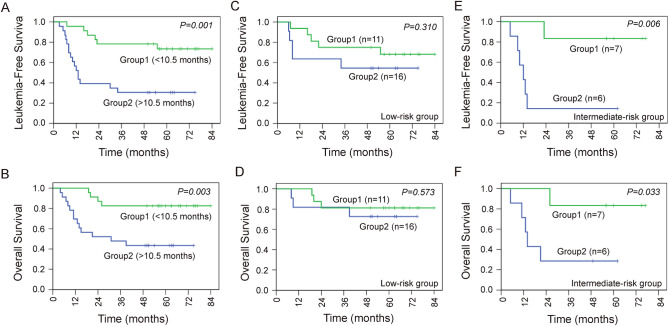
Fig. 3.
LFS and OS according to the persistence of microchimerism. A The 5-year LFS rate was significantly different (P = 0.001) between group 1 (73.4%) and group 2 (30.4%). B The 5-year OS rate was significantly different (P = 0.003) between group 1 (82.6%) and group 2 (43.5%). C In the low-risk group, the 5-year LFS rate was not significantly different (P = 0.310) between group 1 (n = 16, 68.2%) and group 2 (n = 11, 54.5%). D In the low-risk group, the 5-year OS rate was not significantly different (P = 0.573) between group 1 (n = 16, 81.3%) and group 2 (n = 11, 72.7%). E In the intermediate-risk group, the 5-year LFS rate was significantly different (P = 0.006) between group 1 (n = 6, 83.3%) and group 2 (n = 7, 14.3%). F In the intermediate-risk group, the 5-year OS rate was significantly different (P = 0.033) between group 1 (n = 6, 83.3%) and group 2 (n = 7, 28.6%)

