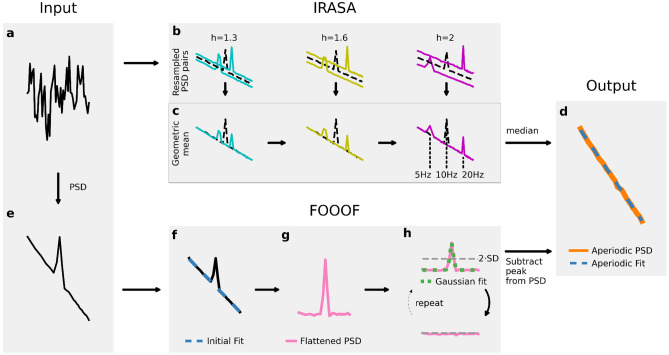
Fig. 1.
Algorithms for 1/f estimation. IRASA: a) Simulated time series. b) PSDs of resampled time series on the y-axis and frequencies on the x-axis. In this figure, the time series is upsampled by the resampling factors of the and downsampled by . c) The geometric mean of all resampling pairs (, ) is calculated. d) The aperiodic component (orange) is the median of the geometric means. A final fit (dashed-blue) estimates the y-intercept and the 1/f exponent . FOOOF: e) A PSD is calculated from the time series. f) FOOOF applies an initial linear fit (dashed-blue) to the PSD in log–log space and g) subtracts the obtained linear trend from the spectrum. h) A Gaussian model (dotted-green) is fitted to the largest peak exceeding the thresholds (dashed-grey) and removes it. The relative threshold is recalculated from the peak-removed flattened spectrum (pink). The procedure is repeated until no peak exceeds the relative threshold. d) Subtraction of all Gaussian models from the original PSD yields the aperiodic component, which is then finally re-fit

