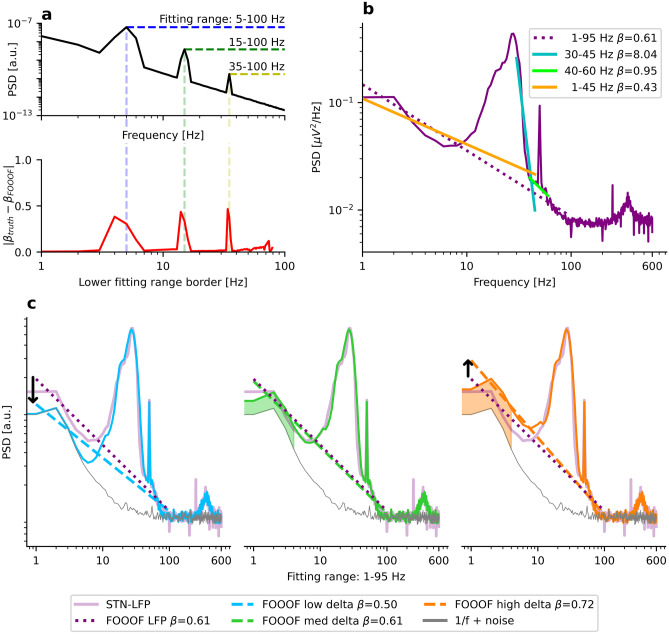
Fig. 3.
Oscillations must not cross fitting range borders. a) Upper panel: PSD of a simulated spectrum with β = 2 and oscillations at 5 Hz, 15 Hz, and 35 Hz (black). The x-axis and the y-axis indicate frequency and PSD, respectively. Lower panel: The exponent is measured using FOOOF for all 80 frequency ranges from 1–100 Hz to 80–100 Hz (red). The x-axis indicates the lower fitting range border, while the y-axis shows the absolute deviation from the ground truth. b) Various frequency ranges commonly used for E–I estimation are applied to an STN-LFP PSD of a Parkinsonian patient (purple). Since many of the chosen ranges overlap with spectral peaks, the estimated exponents are strongly differing. FOOOF parameters: max_n_peaks = 0 (for 30–45 Hz); max_n_peaks = 1 (for 40–60 Hz); peak_width_limits = (1, 100) (for 1–45 Hz and 1–95 Hz). c) The simulated PSD in the middle panel (green) was tuned to match the empirical PSD in b) (purple). FOOOF estimates a similar aperiodic exponent for the simulated and the real spectrum (β = 0.61). When decreasing the power of the 2 Hz delta oscillation (blue), the estimated aperiodic exponent decreases (β = 0.50) despite a constant exponent for the simulated spectrum. When increasing the power of the delta oscillation (orange), the estimated aperiodic exponent increases (β = 0.72)

