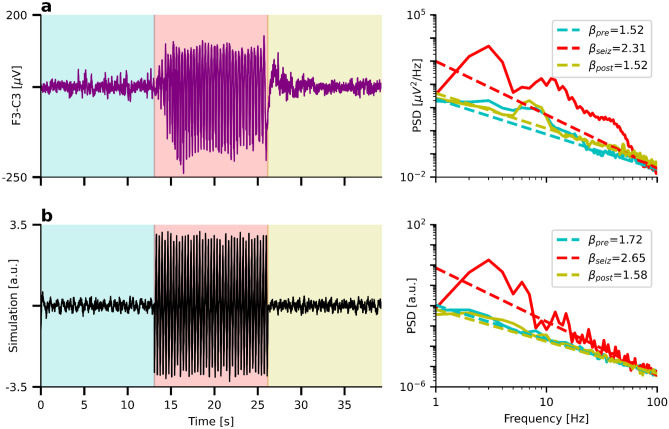
Fig. 4.
FOOOF cannot characterize oscillation peaks that are not clearly distinguishable. a) Left: Time series of an absence seizure measured using EEG. Turquoise: Pre-seizure, red: seizure, yellow: post-seizure activity. Right: Corresponding PSDs and aperiodic FOOOF fits. Note the increase of the 1/f exponent during the seizure. b) Left: Simulated 1/f noise and temporarily (red) added 3 Hz saw-tooth signal. Right: Aperiodic FOOOF fits. Note the increase of the 1/f exponent despite constant ground truth of

