Fig. 5.
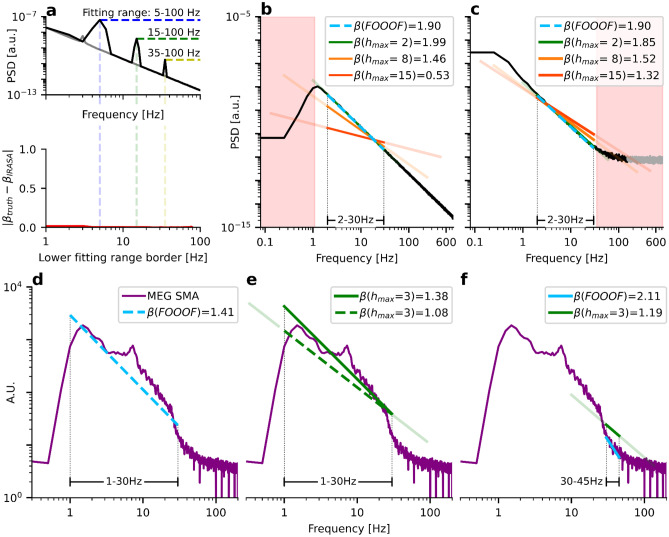
IRASA’s evaluated frequency range is larger than the fitting range. a) Upper panel: Same simulation as in Fig. 3a. Lower panel: The lower fitting range border is shown on the x-axis, the absolute deviation from the ground truth on the y-axis. IRASA correctly estimates the 1/f exponent for all used fitting ranges. b) Simulated aperiodic PSD with a ground truth of . A 1 Hz highpass filter disrupts the 1/f power law. IRASA’s fitting range for the maximum resampling factor is indicated as bright-colored lines upon the fitted aperiodic components, with the evaluated frequency ranges after up- and down-sampling indicated in corresponding transparent colors. IRASA’s error of the 1/f estimation increases with larger resampling rates (and lower resampling rates 1/, respectively). c) Same as b) with a spectral plateau disrupting the 1/f power law. d) FOOOF 1/f estimate within 1–30 Hz for a spectrum obtained from voxel data after MEG source reconstruction. e) IRASA 1/f estimates for an evaluated frequency range of 1–30 Hz (green) and an evaluated frequency range of 0.3–90 Hz (green-dashed, corresponding to a fitting range of 1–30 Hz at hmax = 3). f) FOOOF (blue) and IRASA (green) estimates of the 1/f exponent for the same fitting range of 1–30 Hz

