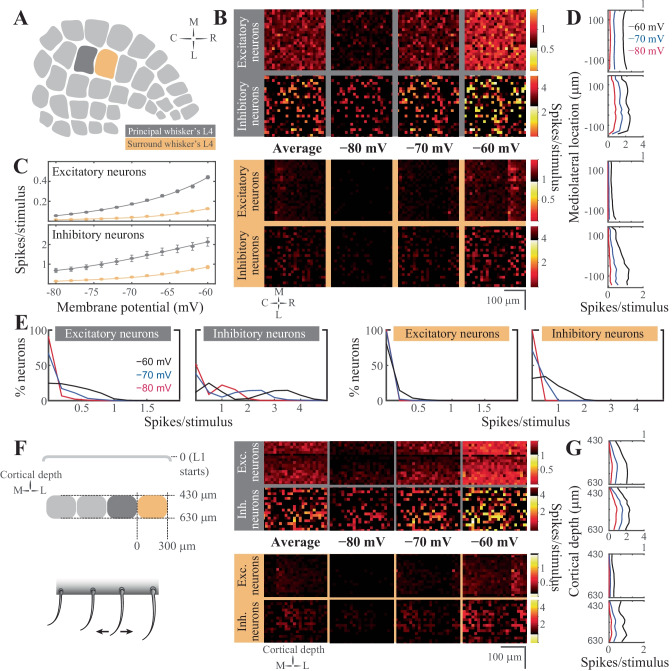
Fig. 4.
Stimulus evoked representations in cortical layer 4 in silico. (A) Schematic representation of the spatial orientation of the simulated network. The visualizations are in the tangential plane. The principal cortical column is the D2 whisker’s column. (B) Average neuronal response in rostro-caudal (RC) and medio-lateral (ML) planes, across different resting membrane states (pixel size 15 × 15 μm in cortical tissue). The figurines on the grey shaded background display the response in the principal whisker’s cortical column; the yellow background shows the activity in the first order surrounding L4. (C) Average firing rate of excitatory (top) and inhibitory neurons (bottom) in the network as a function of the resting membrane potential before stimulus onset in the principal (top) and surround (bottom) whisker’s L4. (D) Average firing rate in the ML axis across the membrane states. (E) Distribution of the spiking response per stimulus across neuron classes and membrane states. (F) Left: Schematic representation of the coronal orientation of the visualized network. Right: Average neuronal response across the dorsoventral plane in L4 (pixel size 15 × 15 μm in cortical tissue). (G) Average firing rate across cortical depth

