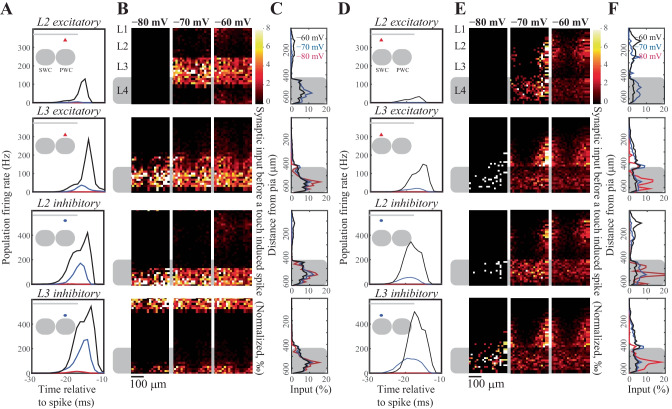
Fig. 6.
Visualization of the presynaptic population contributing to a postsynaptic action potential. We spatially mapped the neural activity across the granular and supragranular layers prior to an action potential in a given layer. These postsynaptic spike-triggered maps were averaged across all postsynaptic neurons that fire evoked action potentials during the simulations. (A) Population activity that drives L2 excitatory (first row), inhibitory (second row), L3 excitatory (third row) and L3 inhibitory (last row) neurons to spike in response to thalamic input. The first spike fired by aforementioned L2 or L3 neurons was used as the trigger to calculate the spike-triggered input map. Insert: schematic representation of the location of different cell populations in the barrel column. (B) Spike triggered spatial averaging (rows as in A); columns denote network activity observed across different resting membrane potentials. (C) Average (over time, trials and neurons) depth distribution of excitatory inputs to drive a spike (rows as in A). (D-F) Same as A-C, but using surround whisker stimulation (SWC) instead of principal whisker stimulation (PWC). The pixels in the spike-triggered maps are normalized as follows: the intensity (a.u.) for each pixel is calculated: where is the spike train of presynaptic neuron i (so each spike adds 1 to the sum). Next, this is averaged over all postsynaptic neurons and all pixels to get to the ratio of pixel :

