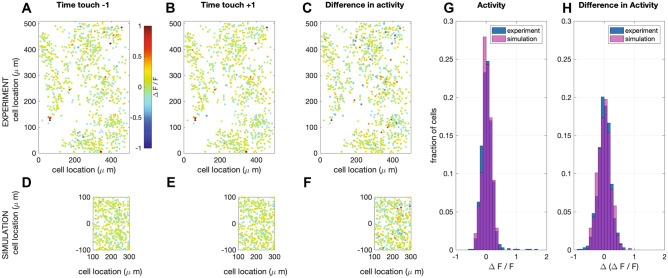
Fig. 9.
Simulation of calcium imaging experiment in L2/3. (A) Recorded (Peron et al., 2015) network response one (time) frame before touch (sampling frequency: 7 Hz; recorded volume: 6). (B) Recorded network response one frame after touch (C) Difference in network response between before and after touch. (D-F) Same as in A-C, but now for simulations (full simulation: single barrel including L23 (shown here) and L4 (see supplemental Fig. 4). The fluorescence signal was calculated from network response following the method in (Vogelstein et al., 2009) (see Materials and Methods). Note that a recorded volume is larger than a single barrel. The frames are scaled accordingly. (G) Comparison of the distribution of activity of one frame after touch between the recorded and the simulated network. (H) Comparison of the distribution of the difference in activity between one frame before and after touch between the recorded and the simulated network

