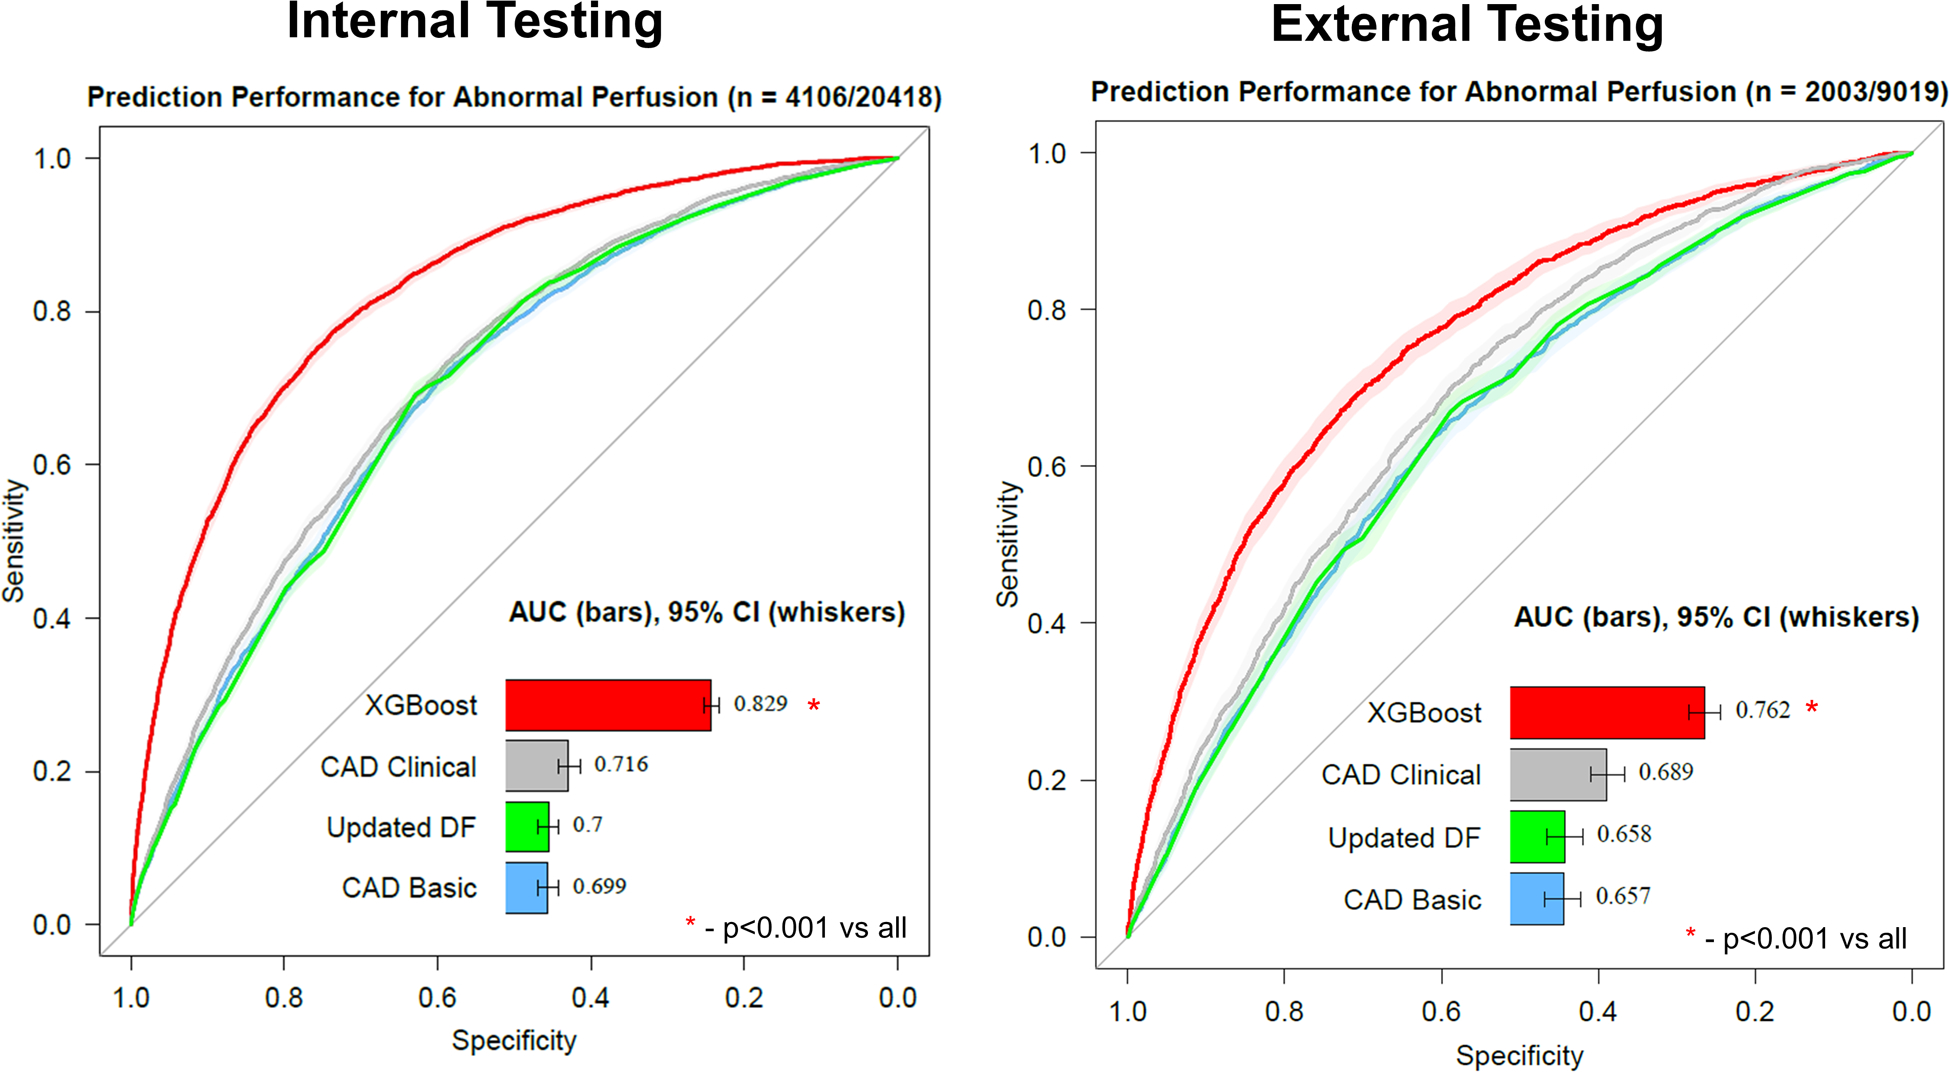
Figure 2: Prediction performance.

Prediction performance for abnormal perfusion from pre-test information in internal testing (left) and external testing (right). The machine learning model (XGBoost) had higher prediction performance compared to the coronary artery disease (CAD) consortium basic or clinical models as well as the updated Diamond-Forrester (DF) model (all p<0.001). AUC – area under the receiver operating characteristic curve, CI – confidence interval.
