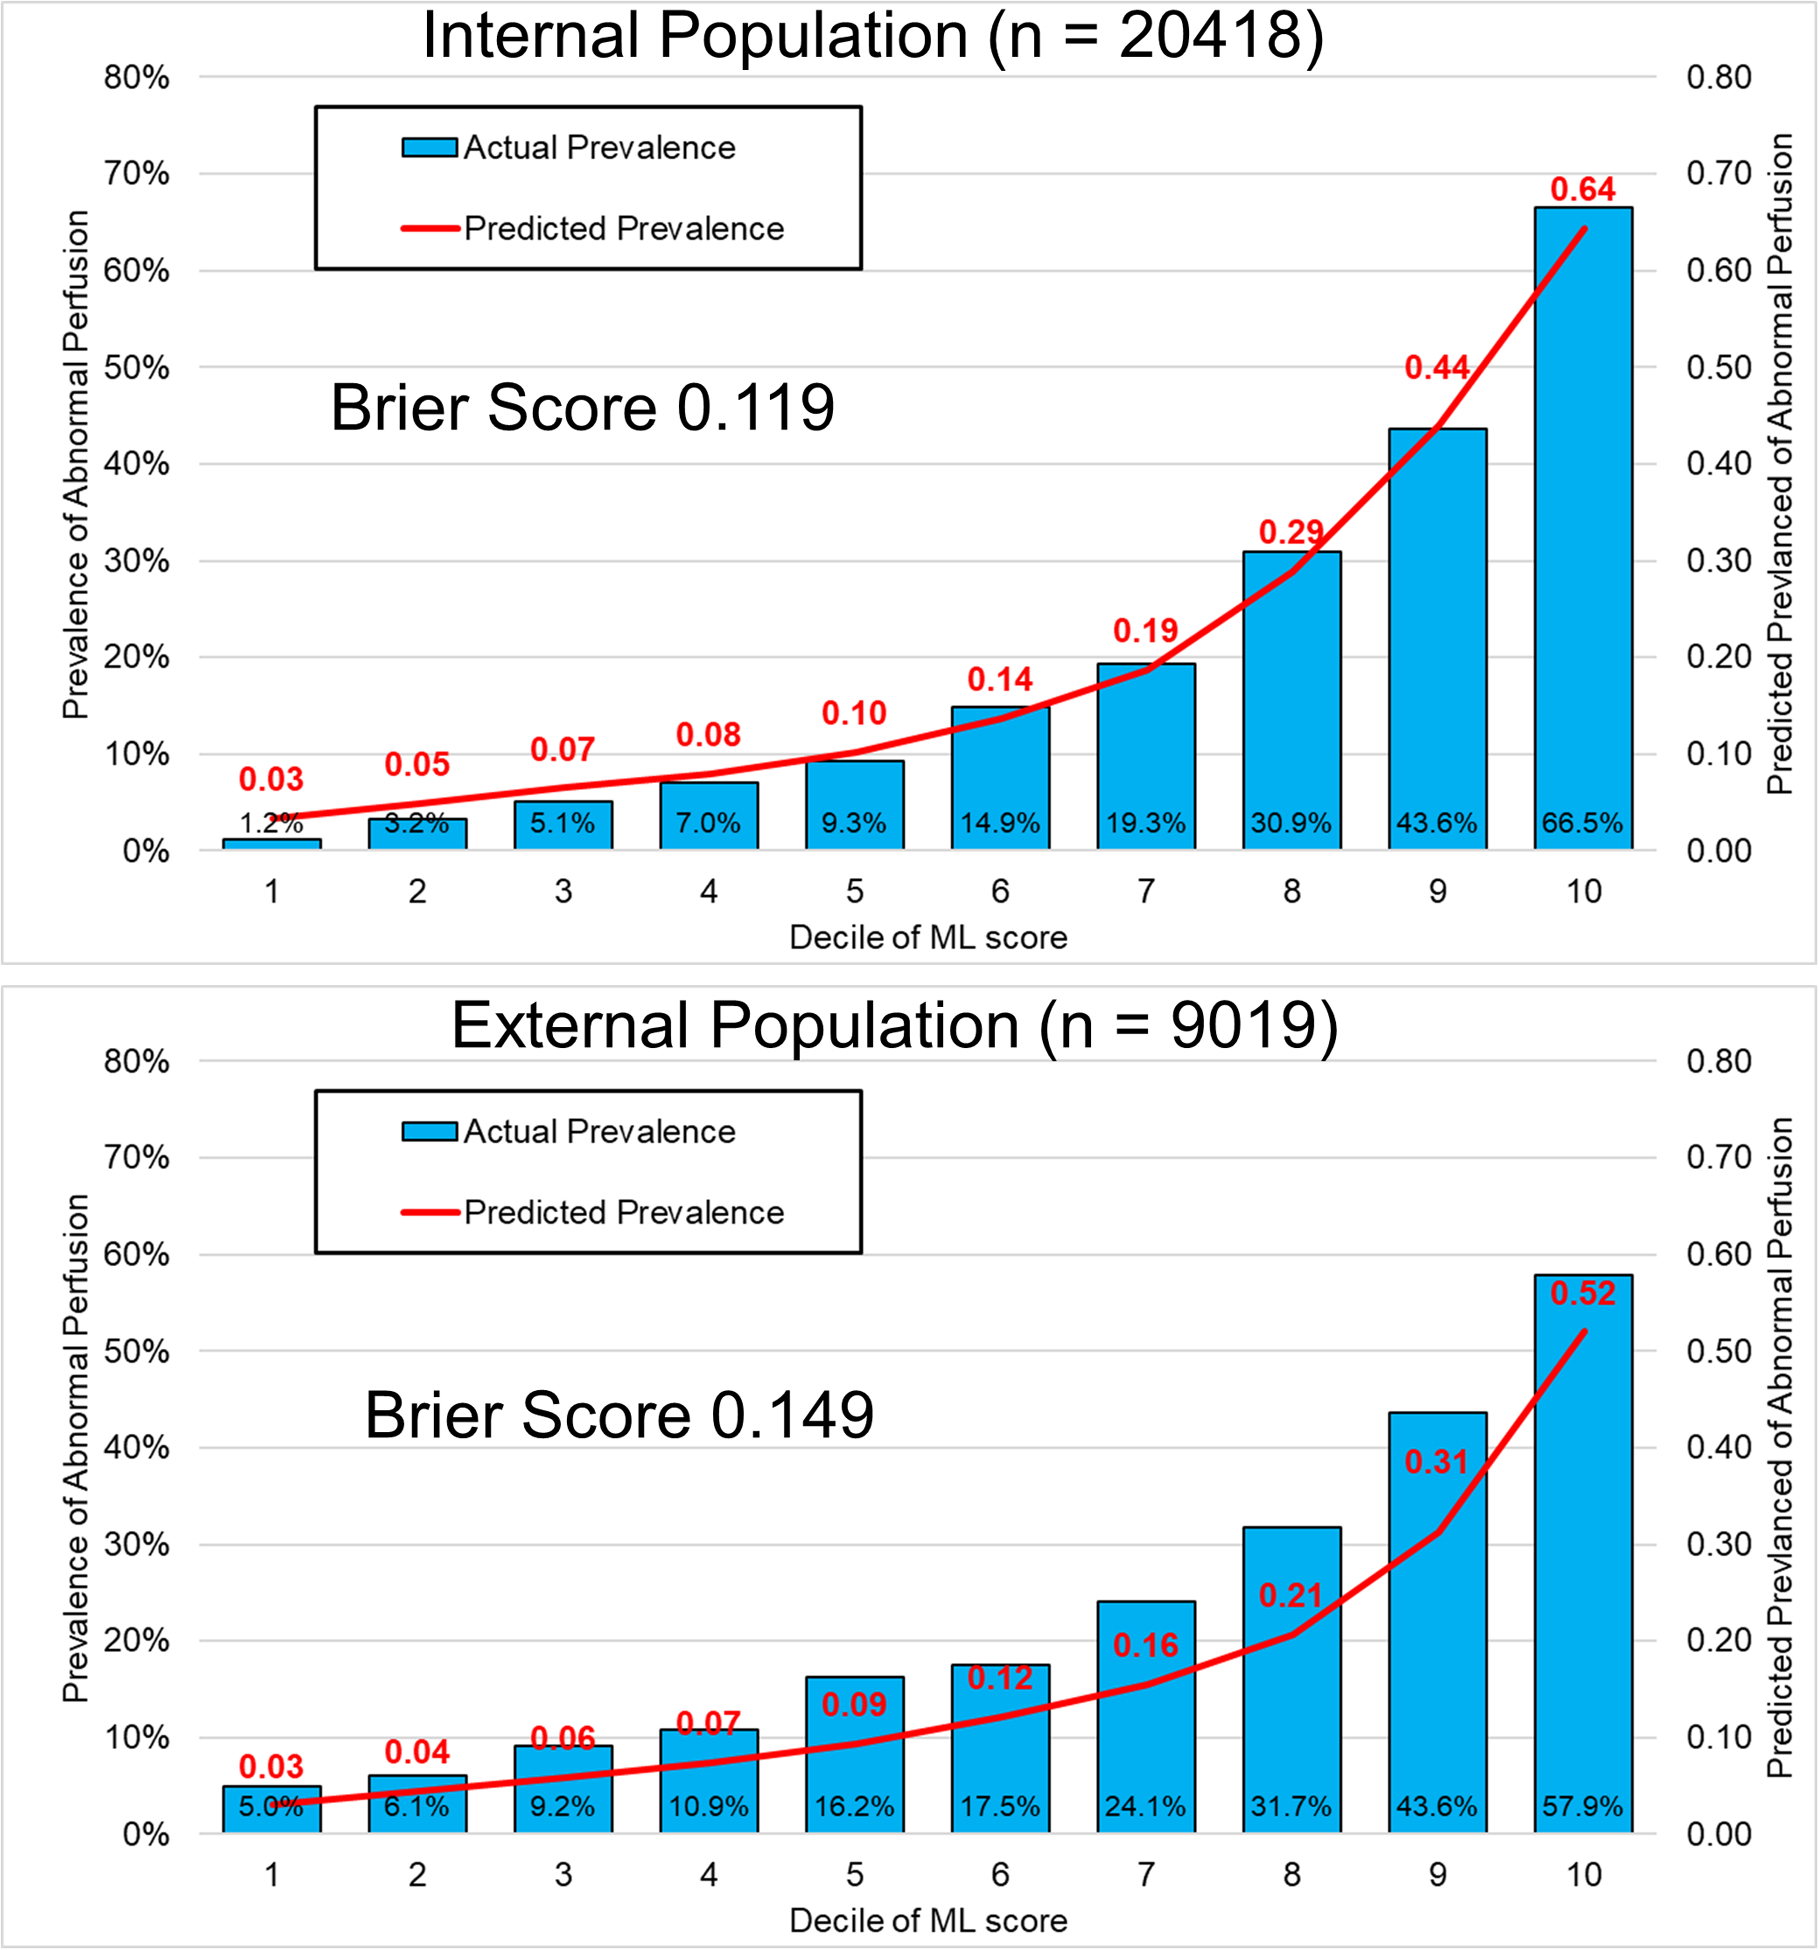
Figure 3: Model Calibration.

Calibration graph showing the predicted proportion of patients with abnormal perfusion and actual proportion of patients with abnormal perfusion by decile of machine learning (ML) score. The model calibration for the internal population (top) was higher compared to the external population (bottom), where there was a tendency to underestimate prevalence of abnormal perfusion.
