
Figure 2:
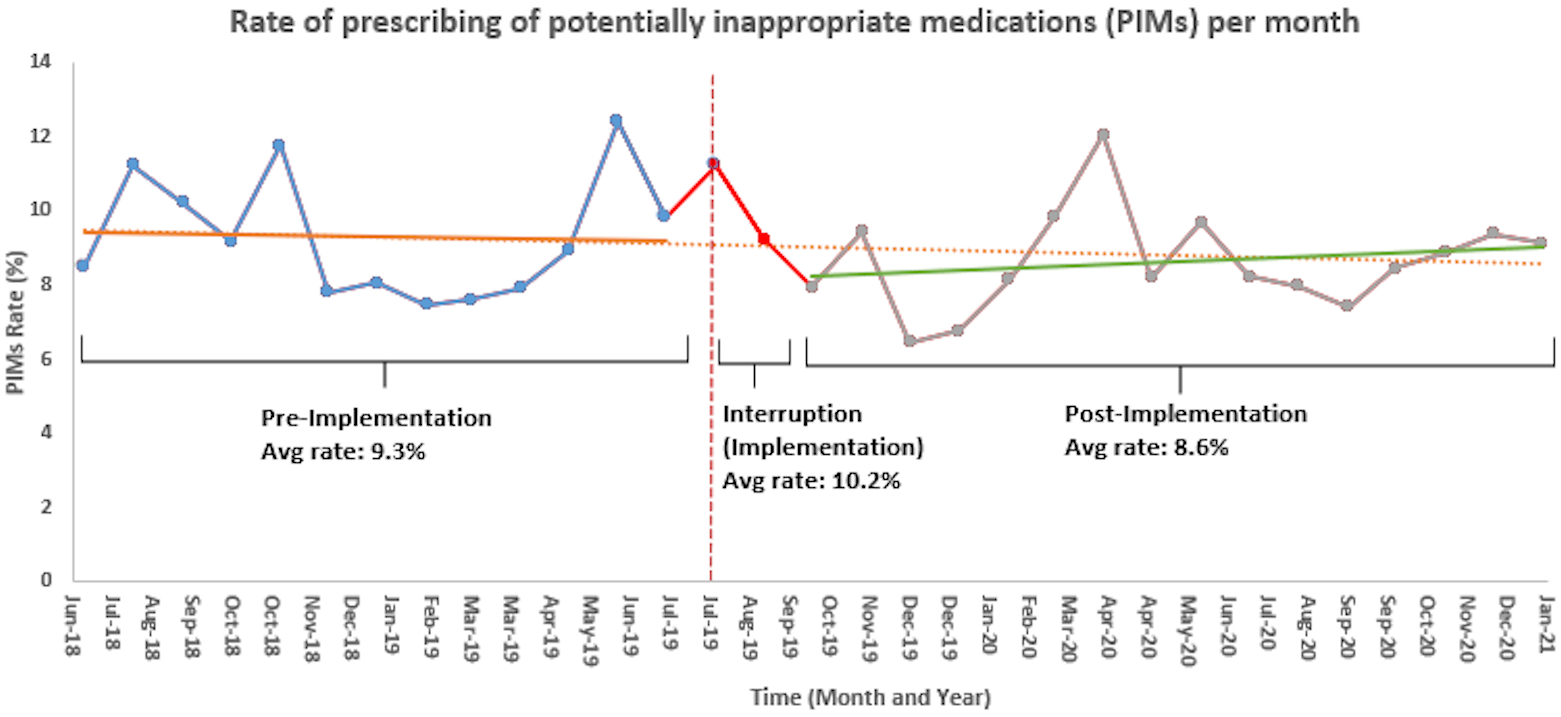
Rate of prescribing of potentially inappropriate medications (PIMs) per month
NOTE: The pre-implementation period data points are denoted by the blue dots and a solid orange line for the slope. The interruption (implementation period) is denoted by the red dots and the interruption point is depicted with a vertical dotted red line. The post implementation period is denoted by grey dots and a solid green line for the slope. The counterfactual slope is depicted with the dotted orange horizontal line, which was generated using the forecast function in excel based on data from the pre-implementation period.
NOTE: This figure was created by the authors of this paper and has not been reused.