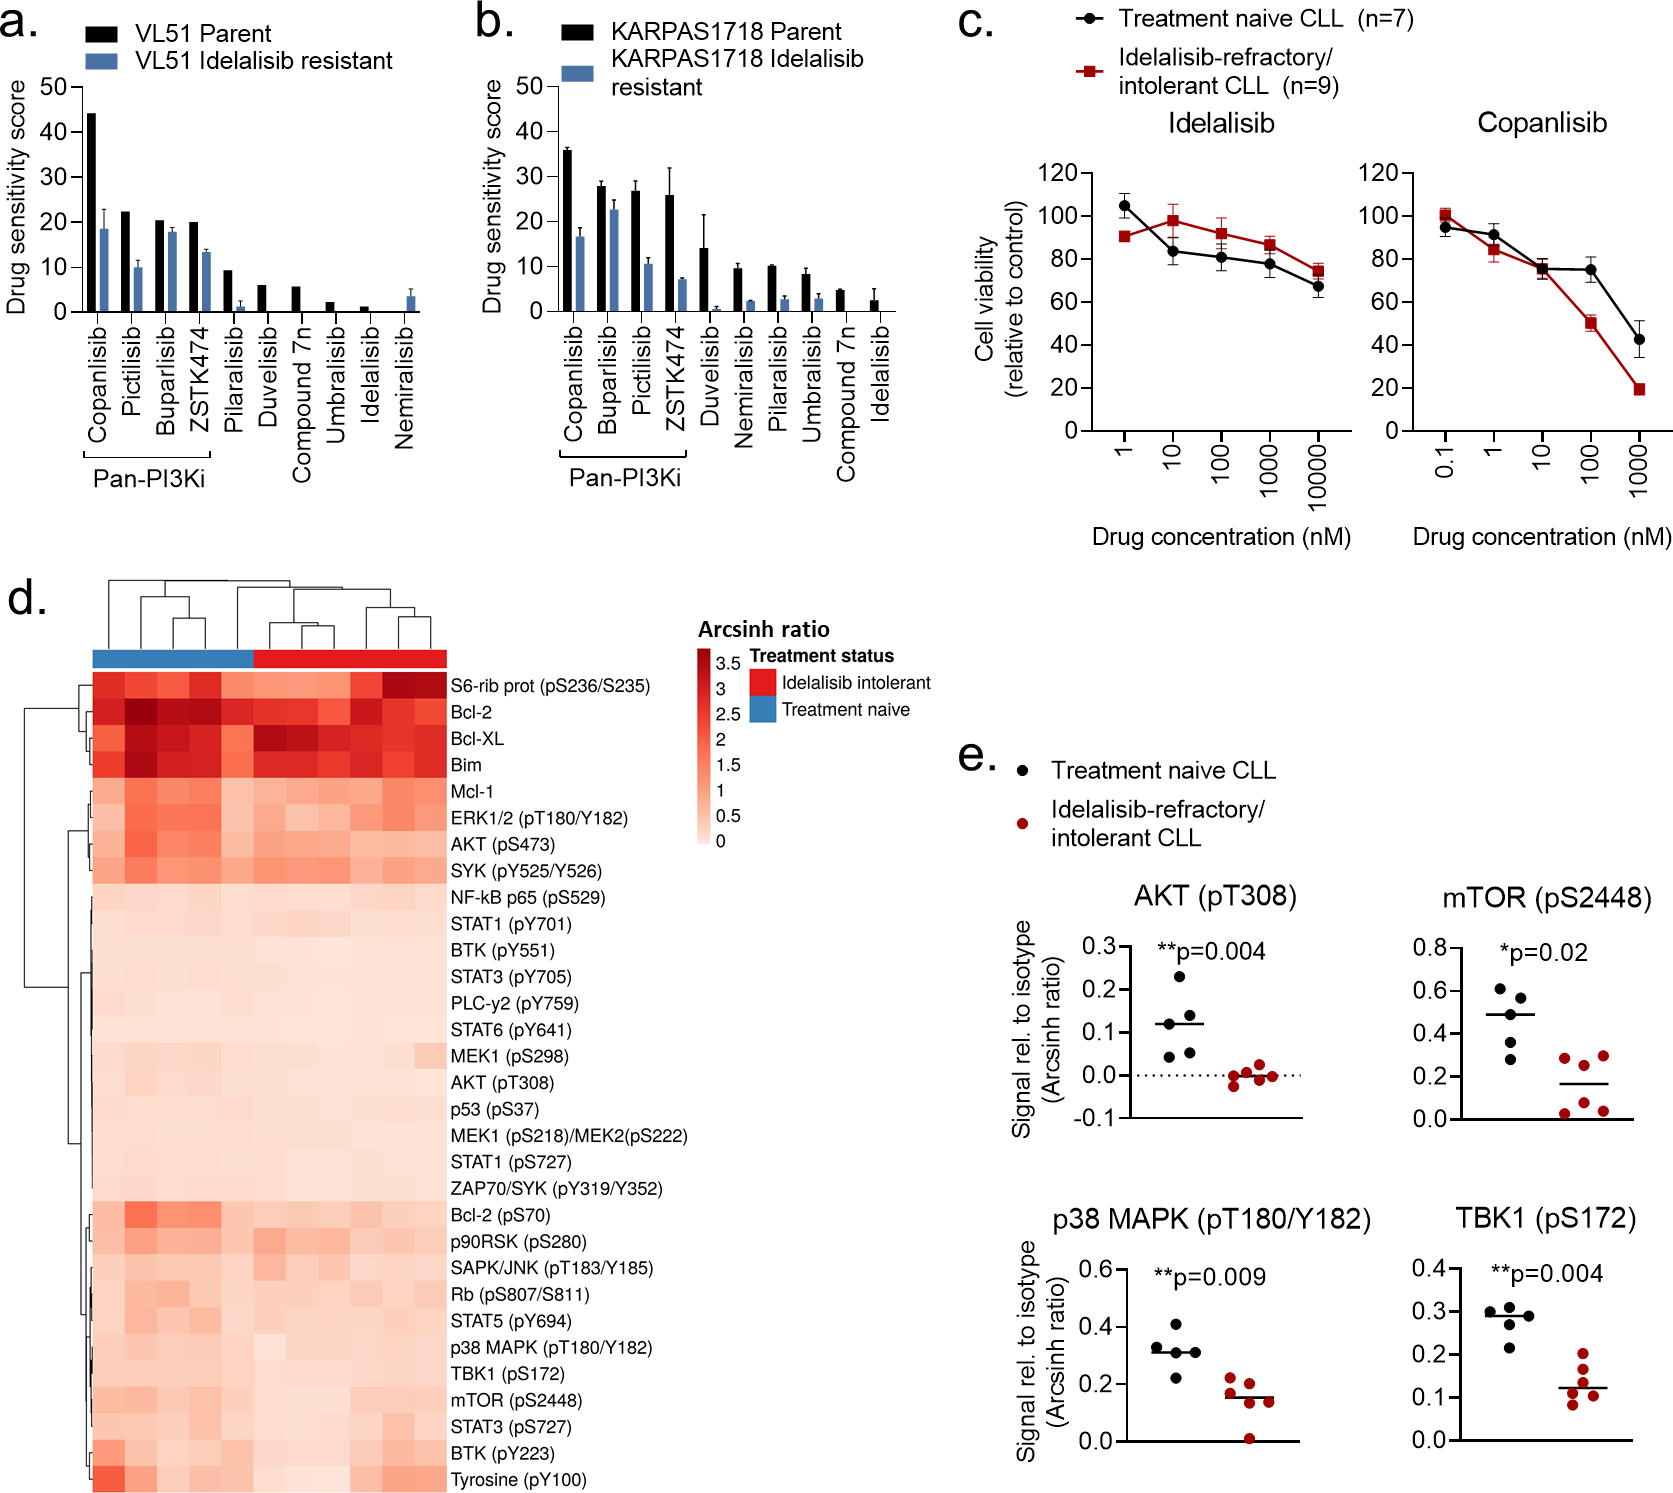
Figure 3. Pan-PI3Ki are active in idelalisib-refractory/intolerant CLL cells.

a-b) VL51 and KARPAS1718 (parent and idelalisib resistant) cell lines were treated with the indicated PI3Ki at 5 concentrations (0.1 nM – 1000 nM for copanlisib, 1 nM – 10000 nM for the others) for 72h. Cell viability was assessed with the CellTiter-Glo assay. The drug sensitivity score was calculated for each treatment based on the area under the dose-response curve. High score indicates high sensitivity to the treatment. The experiment were performed twice or once (VL51 parent). The bars show average with standard deviation.
c) PBMCs from treatment naïve CLL patients (n=7) or idelalisib refractory patients (n=9) were co-cultured with APRIL/BAFF/CD40L+ fibroblasts for 24h. The CLL cells were then separated from the fibroblast layer and treated with the indicated compound and concentrations for 72h. Cell viability was assessed with the CellTiter-Glo assay. The graphs show mean relative cell viability ± standard error of the mean (SEM).
d) Freshly thawed PBMCs from treatment naïve CLL patients (n=5) or idelalisib refractory patients (n=6) were fixed, permeabilized and stained with antibodies against the indicated proteins (rows). Signals were detected in CD19+ B cells by flow cytometry. Raw data were transformed to an arcsinh ratio relative to the signal of an isotype control (color key), which was set to zero. The heatmap was created using ClustVis (https://biit.cs.us.ee/clustvis/). Rows were clustered using Manhattan distance and Ward linkage. Columns were clustered using correlation distance and average linkage.
e) Phosphorylation levels of the indicated proteins are shown for experiments described in (d). The horizontal line indicates median. Statistical testing was done with the Mann-Whitney test.
