
Figure 4. PI3Ki act in synergy with venetoclax.
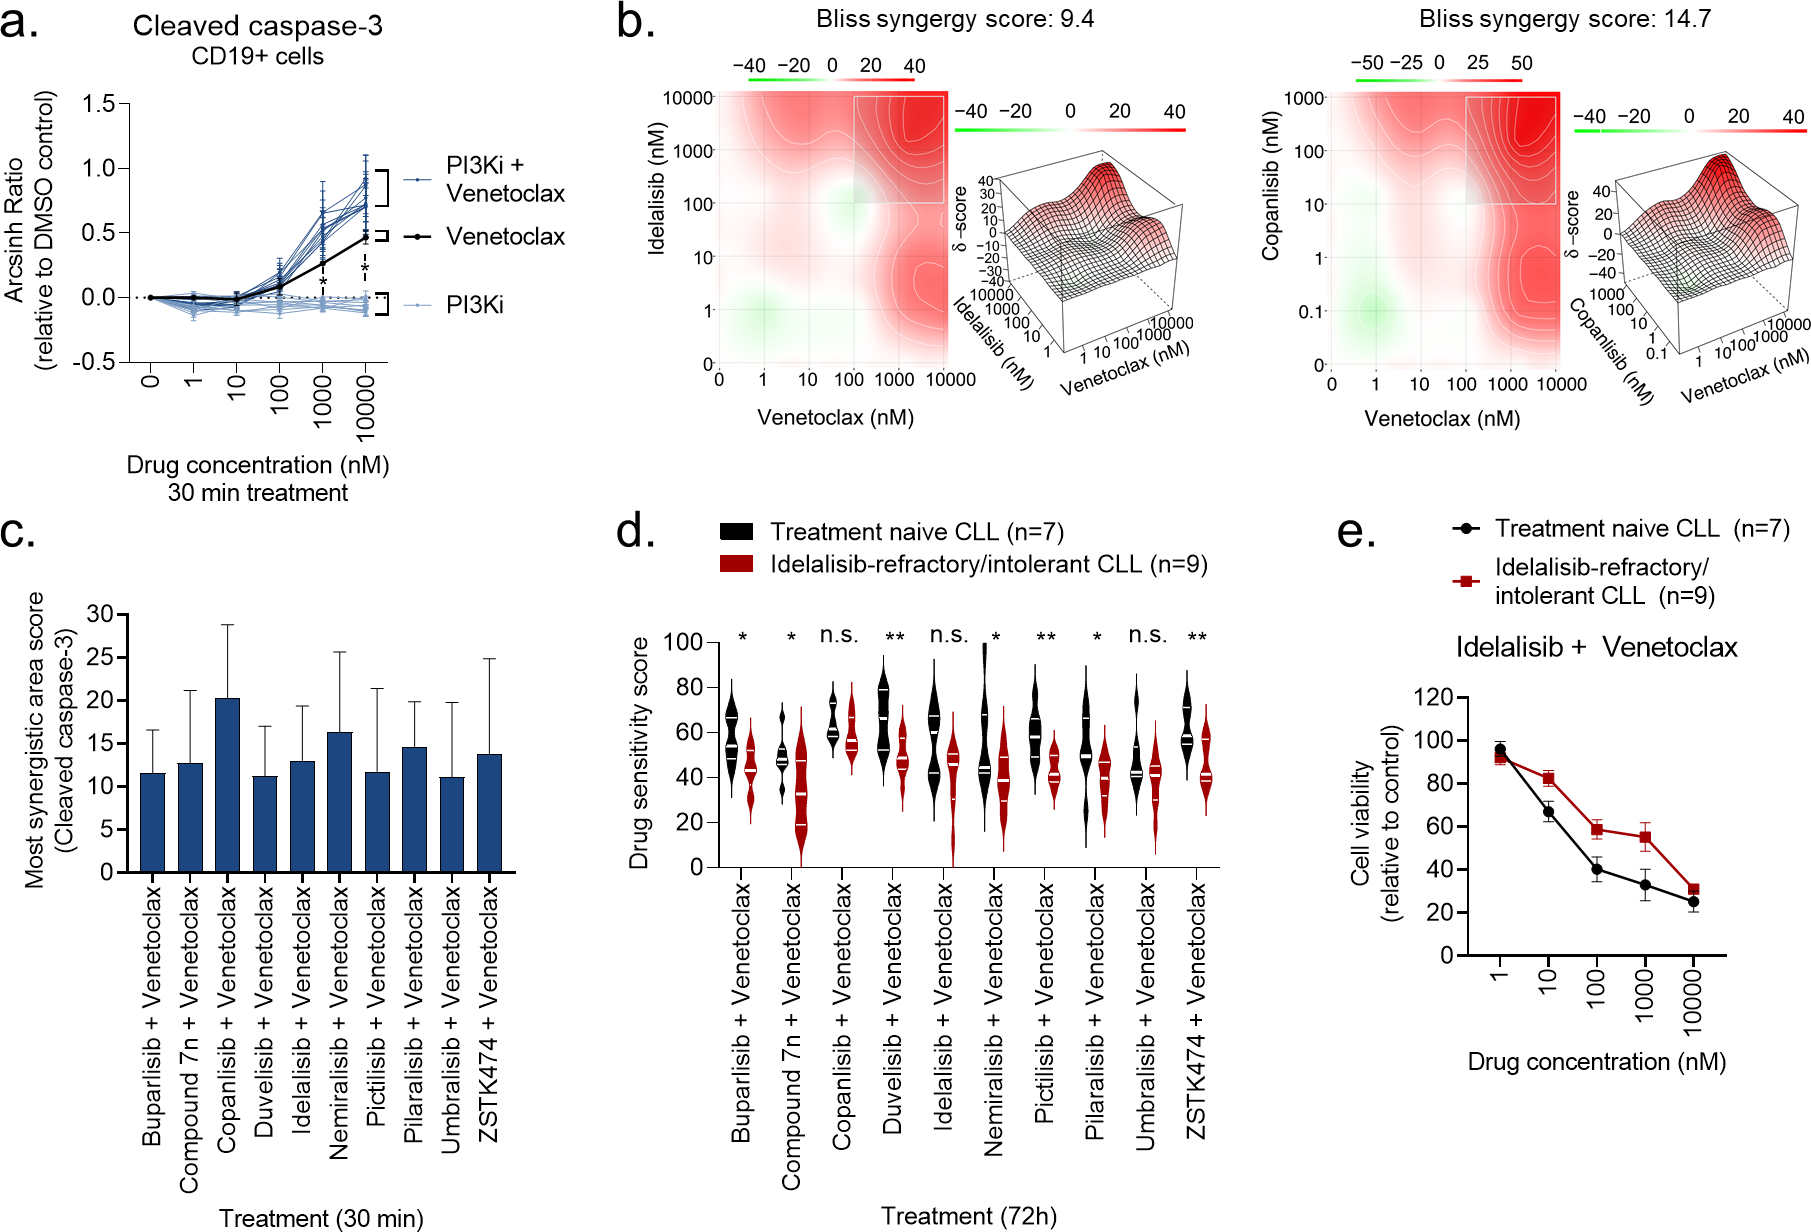
a) Peripheral blood mononuclear cells (PBMCs) from CLL patient samples (n=4) were treated with a PI3Ki, venetoclax, or PI3Ki + venetoclax combinations, at the indicated concentrations for 30 min, followed by 5 min anti-IgM stimulation. The cells were then fixed, permeabilized and stained with anti-cleaved caspase-3. Signals were analyzed by flow cytometry. Results are shown for CD19+ B cells. Raw data were transformed to an arcsinh ratio relative to the signal in DMSO treated control cells, which was set to zero. Curves show the mean ± standard error of the mean (SEM). Statistical testing was done with a one-way ANOVA with Holm-Sidak’s multiple comparisons test. *p<0.05.
b) Normalized data from experiments described in (a) were used in DECREASE (https://decrease.fimm.fi/) to predict the full drug combination dose-response matrices, which were analyzed using SynergyFinder (https://synergyfinder.fimm.fi/) to score the synergy of the drug combinations. Bliss synergy over the full matrix is indicated. A representative plot is shown for the idelalisib + venetoclax and copanlisib + venetoclax combinations.
c) Results are shown for analyses described in (b). The most synergistic area score was calculated by SynergyFinder (https://synergyfinder.fimm.fi/) for the indicated combination treatments. Bars show mean (n=4) ± standard error of the mean (SEM).
d) Peripheral blood mononuclear cells (PBMCs) from treatment naïve CLL patients (n=7) or idelalisib-refractory/intolerant patients (n=9) were co-cultured with APRIL/BAFF/CD40L+ fibroblasts for 24h. The CLL cells were then separated from the fibroblast layer and treated with the indicated drug combinations for 72h. Cell viability was assessed with the CellTiter-Glo assay. The drug sensitivity score was calculated for each treatment based on the area under the dose-response curve. High score indicates high sensitivity to the treatment. Violin plots show min to max response with lines at quartiles and median. Statistical testing was done with an unpaired t test. *p<0.05, **p<0.01, n.s; not significant.
e) Peripheral blood mononuclear cells (PBMCs) from treatment naïve CLL patients (n=7) or idelalisib-refractory/intolerant patients (n=9) were co-cultured with APRIL/BAFF/CD40L+ fibroblasts for 24h. The CLL cells were then separated from the fibroblast layer and treated with idelalisib + venetoclax combination at the indicated concentrations for 72h. Cell viability was assessed with the CellTiter-Glo assay. The graph shows mean relative cell viability ± standard error of the mean (SEM).