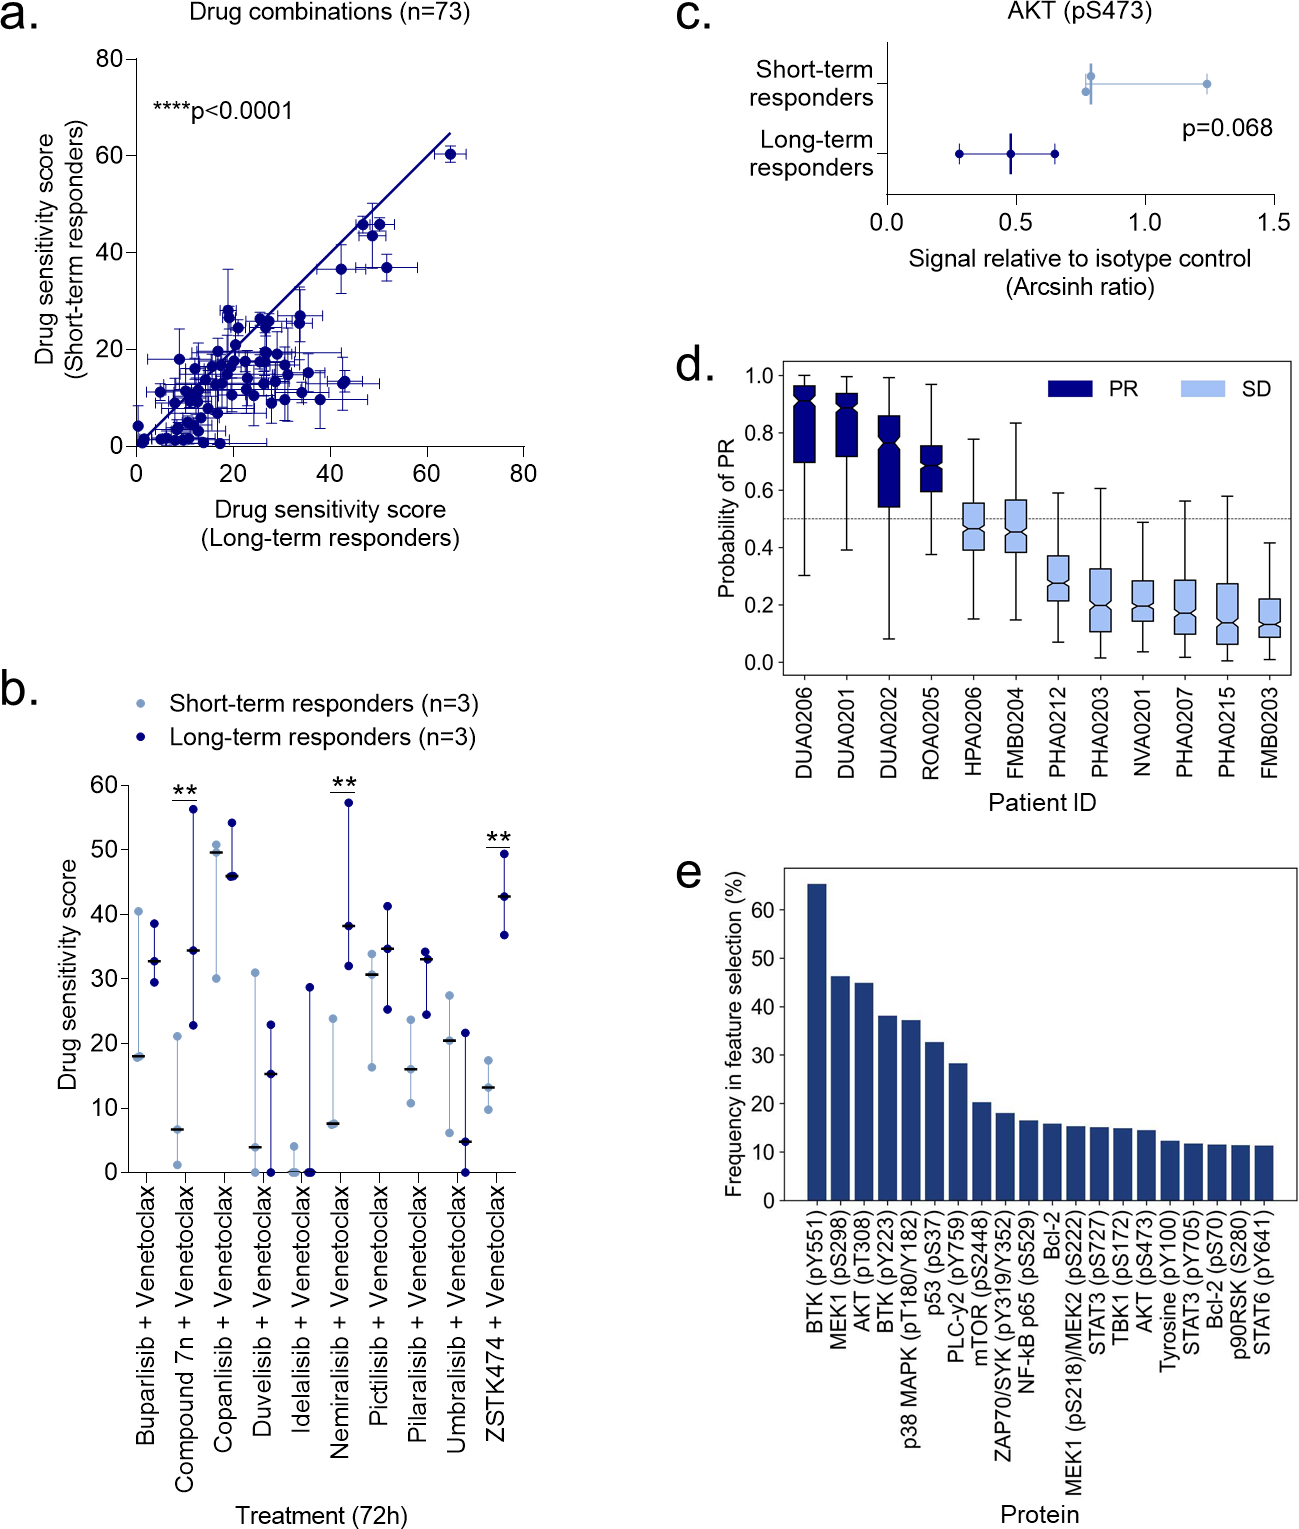
Figure 5. Ex vivo drug sensitivity and protein profiles stratify responders to idelalisib and umbralisib therapy.

a) Drug sensitivity screens were performed with 73 drug combinations on PBMCs collected from CLL patients before the patients started treatment with idelalisib (n=3 short-term responders, i.e. developed resistance to idelalisib, and n=3 long-term responders). Each data point indicates the mean drug sensitivity score to one drug combination. Error bars show standard error of the mean (SEM) over the patients (n=3). The diagonal line indicates equal sensitivity in long- and short-term responders. Statistical testing was done with a paired t test comparing short-term responders to long-term responders. ****p<0.0001.
b) As in (a), but with the indicated PI3Ki + venetoclax combinations. The dot plot shows median with range. Statistical testing was done with a 2-way ANOVA with Sidak’s multiple comparisons within treatment groups for the 73 drug combinations. **p<0.01.
c) Peripheral blood mononuclear cells (PBMCs) collected from short-term and long-term responders at the time of response to idelalisib were fixed, permeabilized and stained with anti-AKT (pS473). Signals were detected in CD19+ B cells by flow cytometry. Raw data were transformed to an arcsinh ratio relative to the signal of an isotype control, which was set to zero. The scatter dot plot shows median with range. Statistical testing was done with an unpaired t test.
d) Peripheral blood mononuclear cells (PBMCs) collected at screening from CLL patients enrolled in a phase 2 trial of umbralisib (NCT02742090) were fixed, permeabilized and stained with antibodies against 31 proteins. The plot shows the predicted probability of partial response (PR) to umbralisib across the 12 CLL patients. A support vector machine (SVM) model was trained using the 31 protein levels as input features with a repeated cross-validation (CV) to avoid over-fitting. Three-fold CV was repeated 500 times to study the stability of the prediction model and its features. The default probability cut-off of 0.5 (the dotted horizontal line) distinguishes patients who obtained a PR from patients who obtained a stable disease (SD) as best response to umbralisib therapy. The boxes show the interquartile ranges, and the solid horizontal lines in each box indicate the median. Error bars show the minimum and maximum probabilities of the SVM predictions across 3-fold cross-validations repeated 500 times.
e) The experiments are described in (d). Recursive Feature Elimination (RFE) was performed using the R package caret. Three-fold cross-validation (CV) was repeated 500 times to investigate the robustness of the protein selection and model accuracy. Proteins were ranked according to their frequency across the RFE runs (i.e., each protein can be selected a maximum of 1500 times). The plot shows the frequency of the top 20 proteins selected by RFE, and the percentage indicates the proportion of CV folds. The higher the frequency the more stable and predictive is the protein for classification of patients between partial response (PR) and stable disease (SD) classes.
