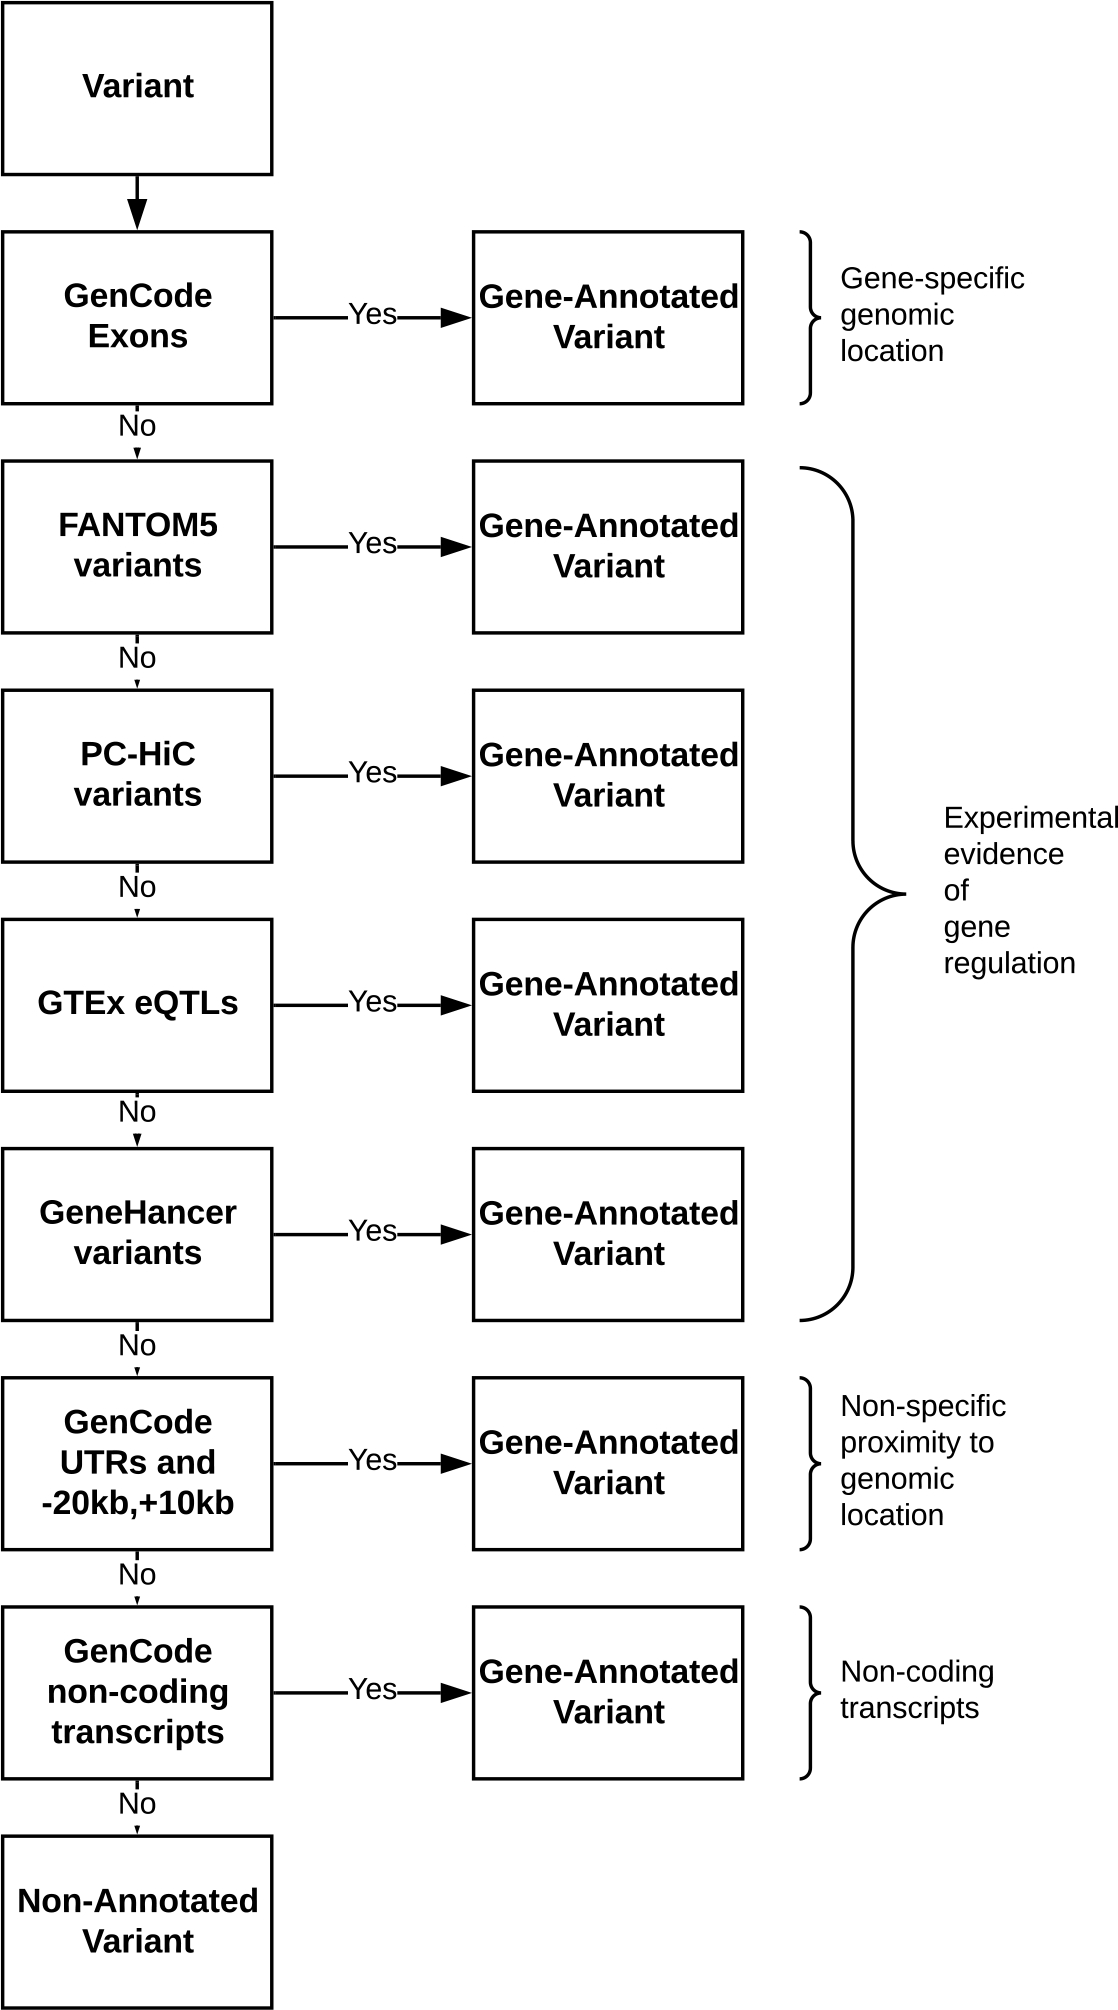
Figure 1:

Flow diagram showing the gene annotation process. Gene annotation process, showing data sources and sequential priority. Single nucleotide variants (SNVs) available in a given data set (“yes”) were annotated to one or more genes and set aside without further annotation. Remaining un-annotated SNVs (“no”) advanced to be considered for annotation using potentially less-definitive methods.
