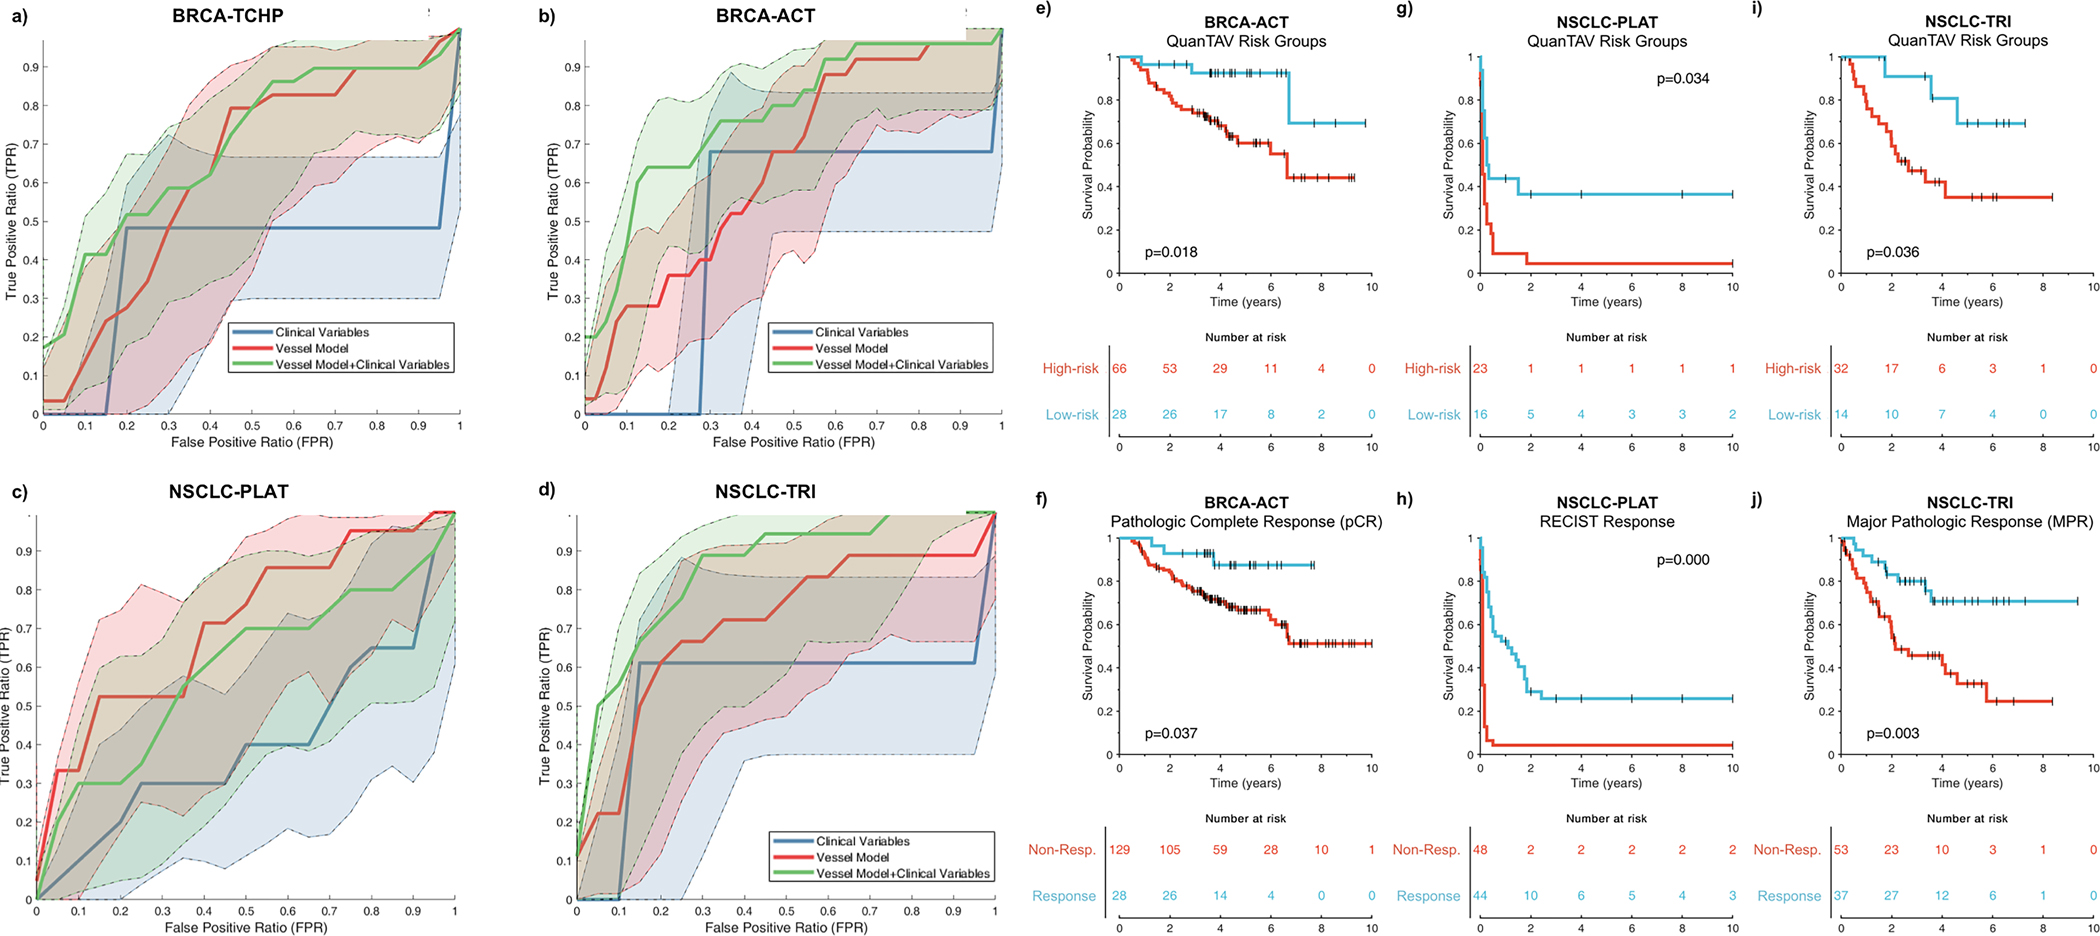
Figure 3.

(a-d) Receiver operating characteristic (ROC) curves for the QuanTAV response score (blue), clinical model (red), and combined QuanTAV and clinical model (green) in testing sets for the four treatment cohorts. a) Prediction of pathological response for breast cancer patients receiving anthracycline-based neoadjuvant chemotherapy (BRCA-ACT, n=144). b) Prediction of pathological response for breast cancer patients receiving HER2-targeted neoadjuvant chemotherapy (BRCA-TCHP, n=69). c) Prediction of response on post-treatment imaging for NSCLC patients receiving platinum-based chemotherapy (NSCLC-PLAT, n=44). d) Prediction of pathologic response for NSCLC patients receiving a trimodality regimen of chemoradiation followed by surgery (NSCLC-TRI, n=44). (e-j) Kaplan Meier curves showing pre-treatment QuanTAV risk groups and post-treatment response. Note that QuanTAV risk groups are shown for the testing set, while response is shown for the full patient population used in this study. e,f) BRCA-ACT: association of QuanTAV risk groups (e) and post-treatment pathologic complete response (f) with 10-year recurrence-free survival. (g,h) NSCLC-PLAT: association of QuanTAV risk groups (g) and post-treatment RECIST response (h) with 10-year progression-free survival. (i,j) NSCLC-TRI: association of QuanTAV risk groups (i) and post treatment major pathologic complete response (j) with 10-year recurrence-free survival.
