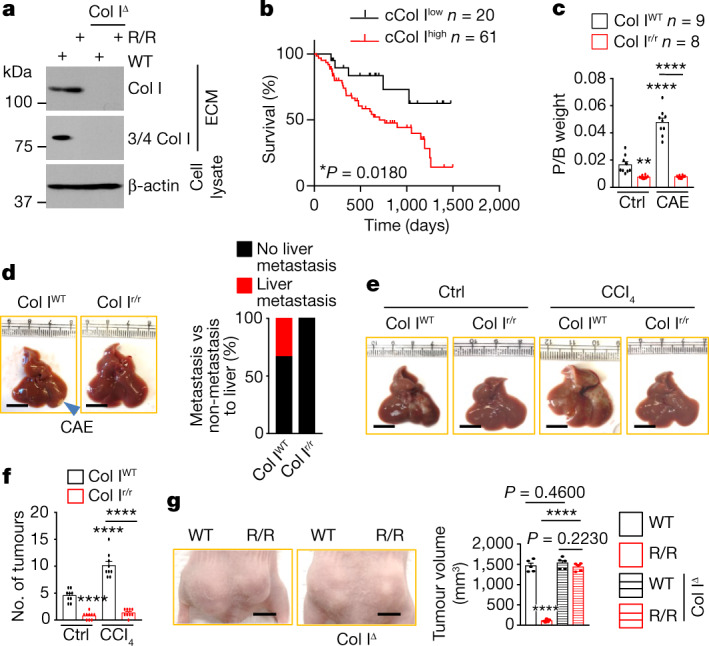
Fig. 1. Col I cleavage controls PDAC growth.

a, Immunoblot showing the specificity of antibodies to iCol I and cCol I (3/4 Col I) in ECM produced by the indicatedfibroblasts. Col IΔ, Col I knockout; WT, wild type. b, Overall survival of patients with resected PDAC stratified according to cCol I expression (shown in Fig. 5a). Significance was determined by log-rank test. c, Pancreas weight relative to body weight (P/B weight) four weeks after orthotopic KPC cell transplantation into Col IWTor Col Ir/rmice that were pretreated with CAE or without CAE. Ctrl, control. d, Liver morphology in CAE-treated mice. Liver metastases were detected in 33% of Col IWTmice. e,f, Liver gross morphology (e) and tumour numbers (f) two weeks after intrasplenic transplantation of KPC cells into Col IWTor Col Ir/rmice with or without CCl4 pretreatment. g, Representative images and sizes of subcutaneous tumours formed by human 1305 cells co-transplanted with WT, R/R or Col IΔ WT or R/R fibroblasts into Nu/Nu mice. Data in f (n = 9 mice), g (n = 5 mice) and c are mean ± s.e.m. Statistical significance determined by two-tailed t-test. Exact P values in c,f are shown in the Source Data. ****P < 0.0001. Scale bars (d,e,g), 1 cm.
