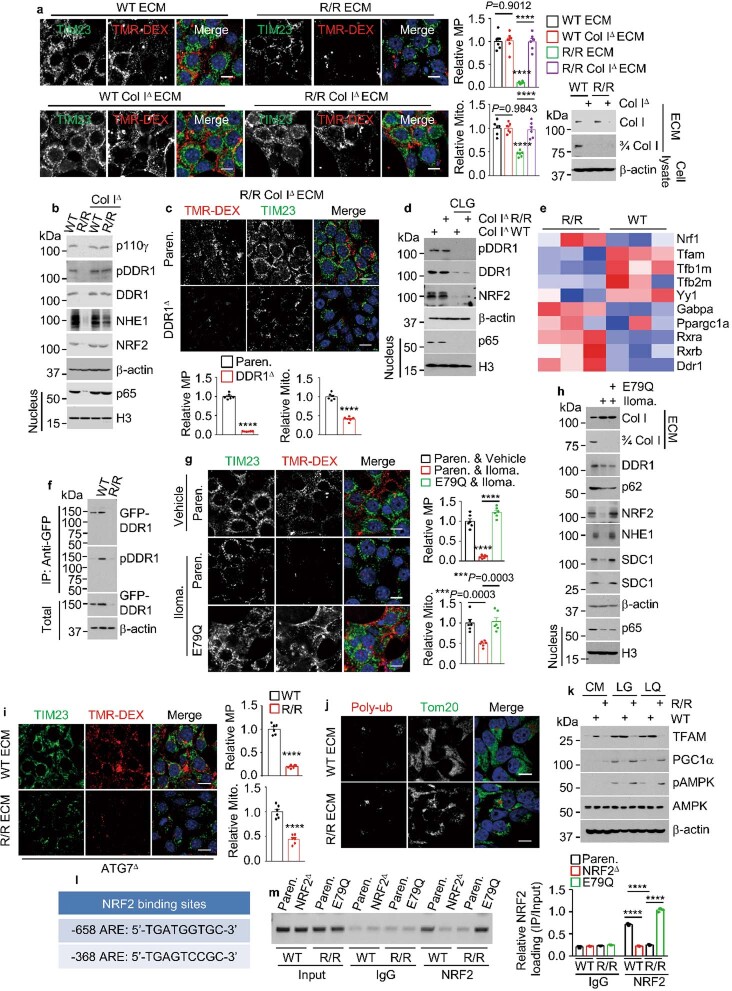
Extended Data Fig. 6. Inhibition of Col I cleavage shuts down NRF2-driven macropinocytosis and mitochondrial biogenesis.
a, MP and mitochondria in KPC cells plated on indicated ECM and incubated in LG for 24 h. Col I IB in indicated ECM preparations is shown on the right. b, IB of indicated proteins in above cells. c, MP and mitochondria in indicated KPC cells plated on R/R Col IΔ ECM and incubated in LG for 24 h. d, IB of indicated proteins in 1305 cells plated on ECM produced by bacterial collagenase (CLG, 50 μg/ml) treated or untreated fibroblasts and incubated in LG medium −/+ CLG for 24 h. e, Genes differentially expressed between KPC cells plated on indicated ECM. Blue: replicates with low expression (z-score = −2); red: replicates with high expression (z-score = +2). f, Immunoprecipitation (IP) of GFP–DDR1 from 1305 cells plated −/+ indicated ECM. g, MP and mitochondria in Paren. or E79Q KPC cells plated on ECM produced by Ilomastat (Iloma.) treated or untreated WT fibroblasts and incubated in LG medium −/+ Iloma. for 24 h. h, IB of indicated proteins in above cells. i, MP and mitochondria in ATG7Δ MIA PaCa-2 cells plated on indicated ECM and incubated in LG for 24 h. j, Imaging of 1305 cells plated on indicated ECM showing rare poly-Ub and Mito. (Tom20) colocalization. k, IB analysis of KPC cells plated −/+ indicated ECM and incubated in indicated media for 24 h. l, Locations of putative NRF2-binding sites (AREs) relative to the transcriptional start site (TSS, +1) of the mouse Tfam gene. m, Chromatin IP probing NRF2 recruitment to the Tfam promoter in KPC cells plated on WT or R/R ECM and incubated in LG for 24 h. The image shows PCR-amplified ARE-containing promoter DNA fragments. Quantitation on the right. Results in (a,c,g,i) (n = 6 fields), (m) (n = 3 independent experiments) are mean ± s.e.m. Statistical significance determined by two-tailed t-test. ***P < 0.001, ****P < 0.0001. Scale bars, 10 μm.

