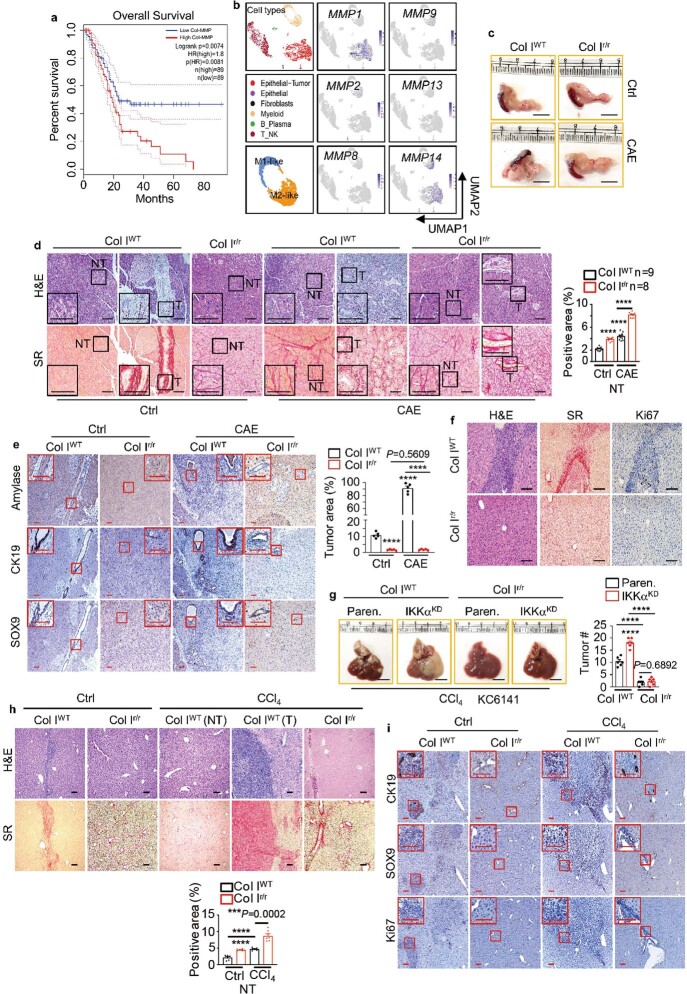
Extended Data Fig. 1. Col I cleavage stimulates PDAC growth.
a, Overall survival of patients with PDAC from TCGA with high and low collagen-cleaving MMP signature (MMP1, 2, 8, 9, 13, 14). Significance was analysed by log-rank test. b, UMAPs showing scRNA-seq data from 5 primary PDACs, displaying cell types and expression of the most abundant MMP mRNAs. c, Pancreas morphology 4 wk after orthotopic KPC cell transplantation into Col IWT or Col Ir/r mice −/+ CAE pretreatment. d, H&E and sirius red (SR) staining of pancreatic sections from above mice. Boxed areas were further magnified. Quantification of SR positivity in nontumor (NT) areas is shown to the right. e, IHC of pancreatic sections from above mice. Quantification of tumour areas is shown to the right. f, H&E, SR, Ki67 staining of liver sections from above CAE-pretreated mice. g, Liver gross morphology and tumour numbers (#) 2 wk after i.s. transplantation of Paren. or IKKα knockdown (KD) KC cells into CCl4 pretreated Col IWT or Col Ir/r mice. h, H&E and SR staining of liver sections 2 wk after i.s. transplantation of KPC cells into Col IWT and Col Ir/r mice −/+ CCl4 pretreatment. Quantification of SR positivity in NT areas is shown at the bottom. i, IHC of liver sections from above mice. Boxed areas show higher magnification. Results in (e) (n = 5 fields), (g), (h) (n = 6 mice) and (d) are mean ± s.e.m. Statistical significance determined by two-tailed t-test. ***P < 0.001, ****P < 0.0001. Scale bars in (d–f, and h,i), 100 μm, (c,g), 1 cm.

