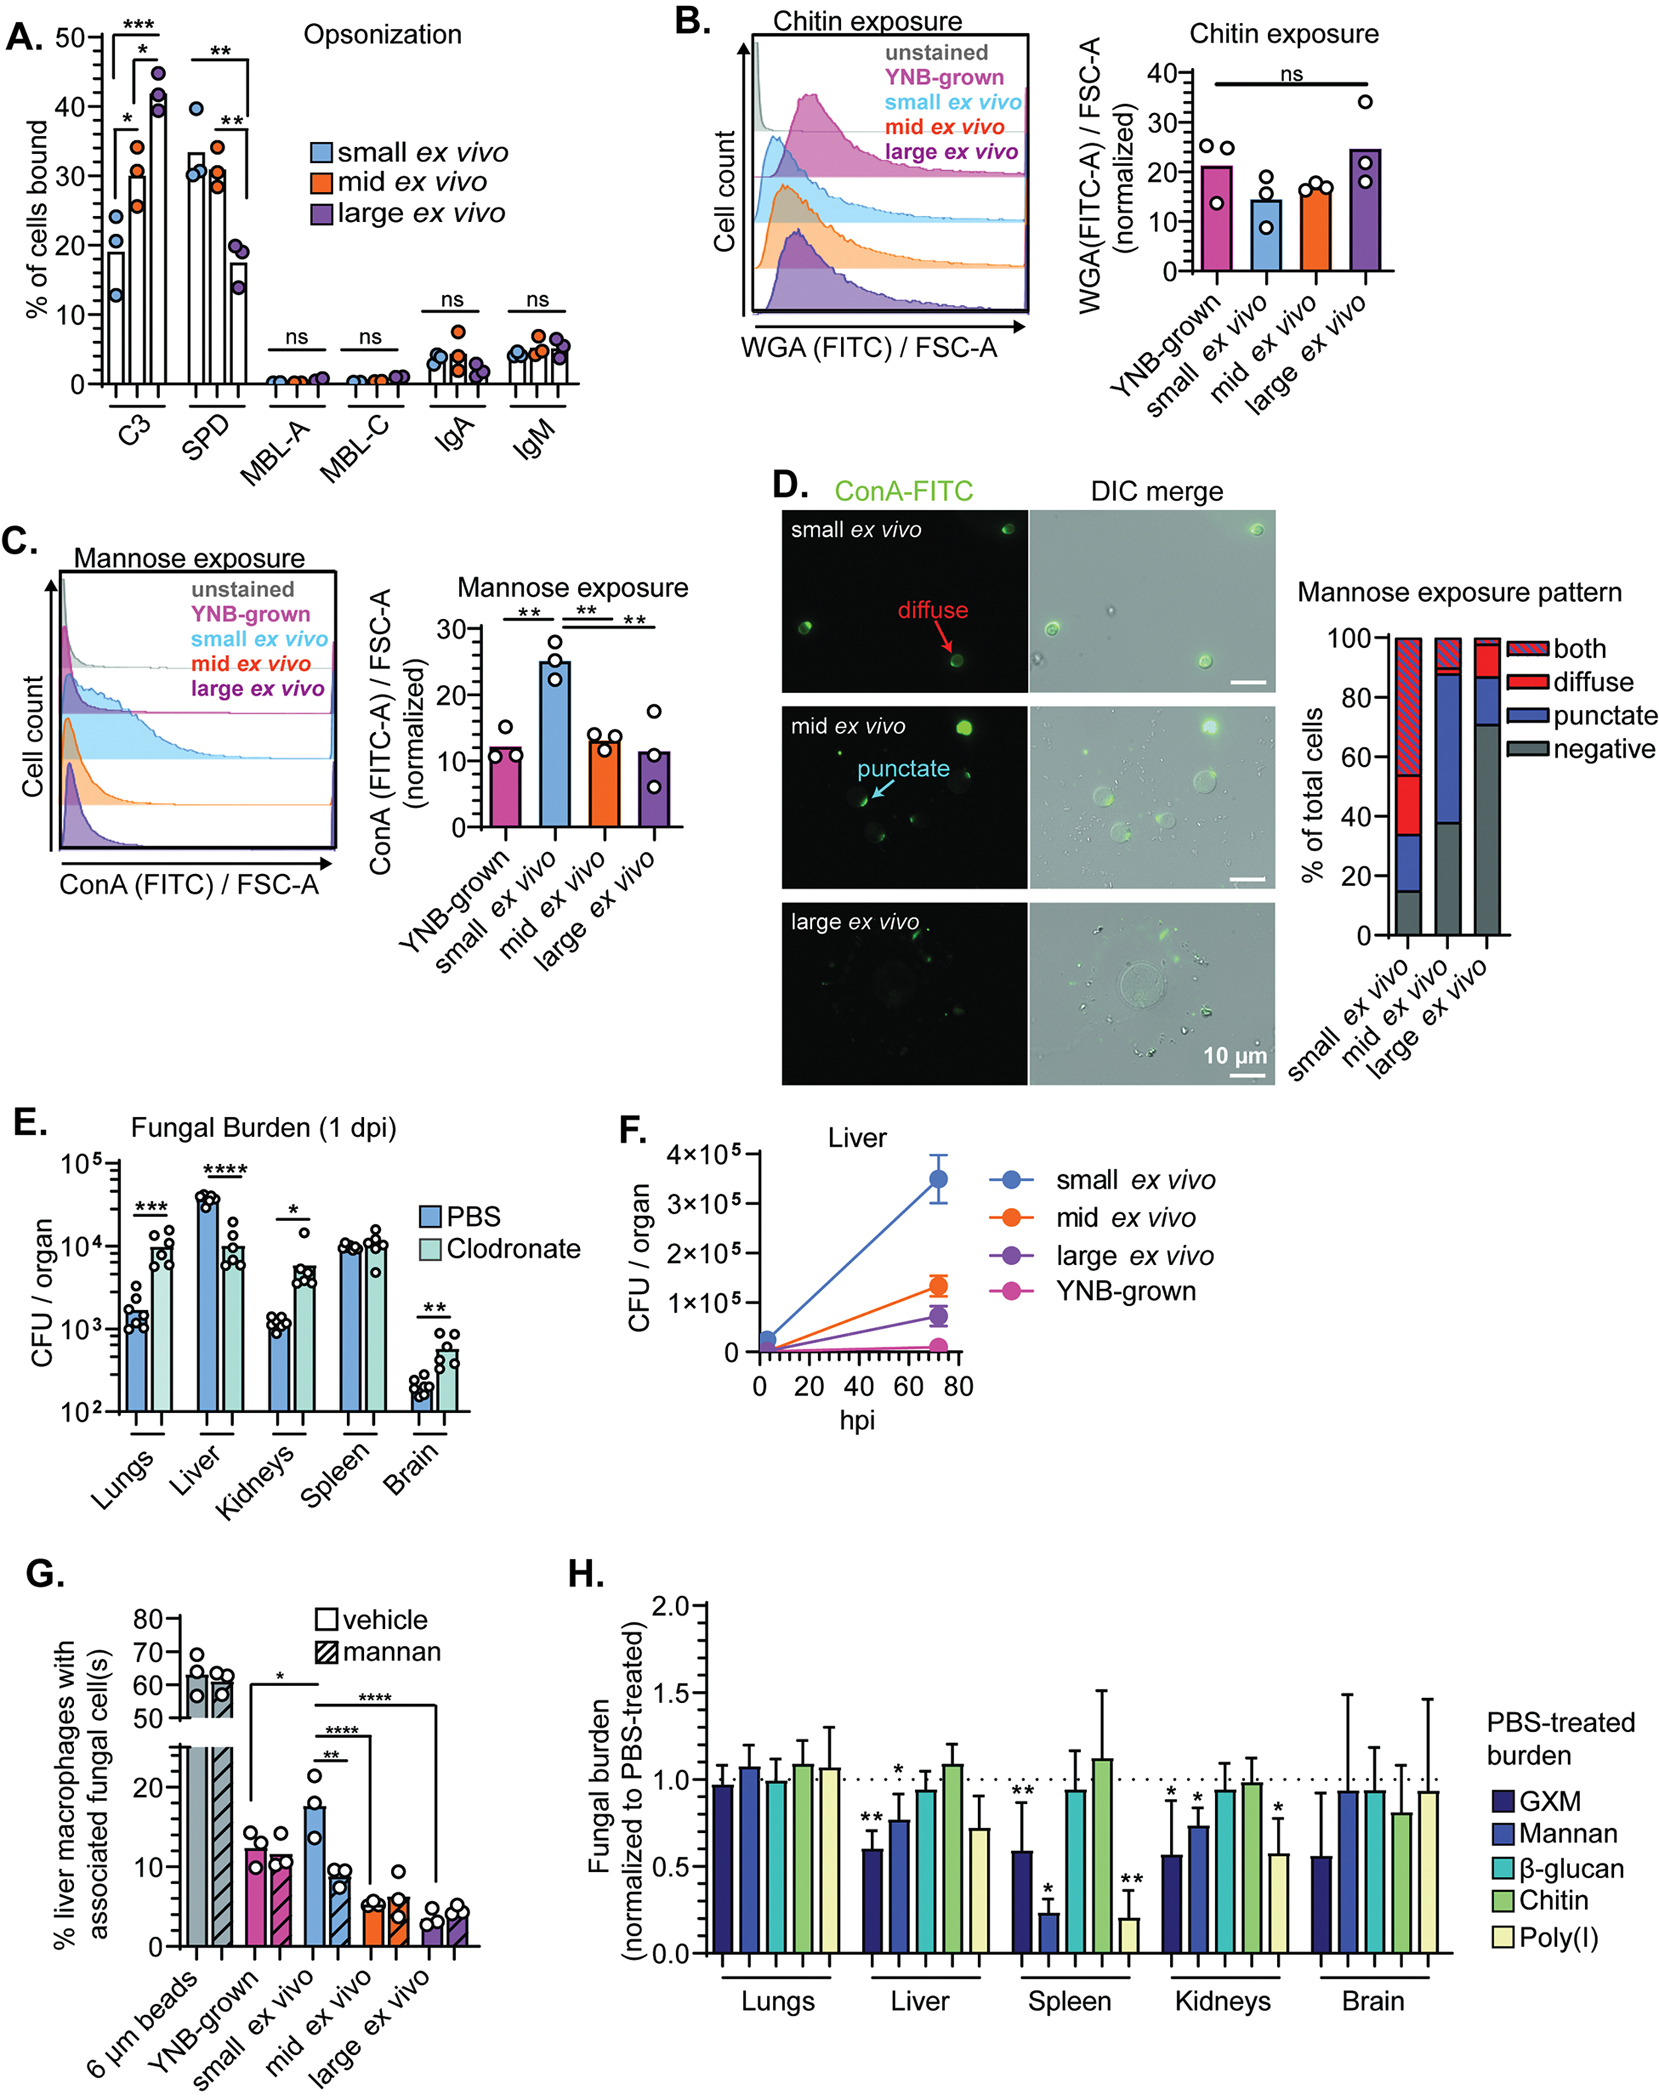
Figure 3: Mannose recognition by macrophages contributes to organ uptake by small ex vivo cells.

(A) Percentage of total cells bound by complement (C3), surfactant protein D (SPD), mannose binding lectins A and C (MBL-A; MBL-C), IgA, and IgM. (B) Representative flow plots and quantification of wheat-germ agglutinin (WGA) stained cells (chitin exposure). (C) Representative flow plots and quantification of concanavalin A (ConA) stained cells (mannose exposure). (D) Representative images and characterization of mannose exposure pattern after staining with ConA (N=50 fungal cells). All comparisons in Figure 2 were analyzed using one-way ANOVA and uncorrected Fisher’s LSD. All bar graphs display the mean. (E) Fungal burden at 1 dpi in mice pretreated with either clodronate or vehicle control (PBS) liposomes and then inoculated with small ex vivo cells and (Unpaired t test). (F) Fungal burden in livers from mice (N=4–6) inoculated with ex vivo fungal cells or YNB-grown fungi at 3 and 72 hpi. Points indicate the mean and error bars the standard deviation. (G) Percentage of primary cultured murine liver macrophages with physically associated plastic beads or fungal cells 4 hpi. Dashed lines indicate 10-minute pretreatment with exogenous mannan (One-way ANOVA and uncorrected Fisher’s LSD; N=2263–3197 total macrophages counted across 3 independent replicates). (H) Fungal burden in mice intravenously treated with indicated ligand 2–3 minutes prior to intravenous inoculation with small ex vivo fungal cells. Mice were perfused 10 minutes post-inoculation and fungal burden was normalized to vehicle (PBS) treated controls (Mann Whitney U-test; N=6 mice per group). Bar graphs display the mean and error bars the standard deviation.
