
Figure 1.
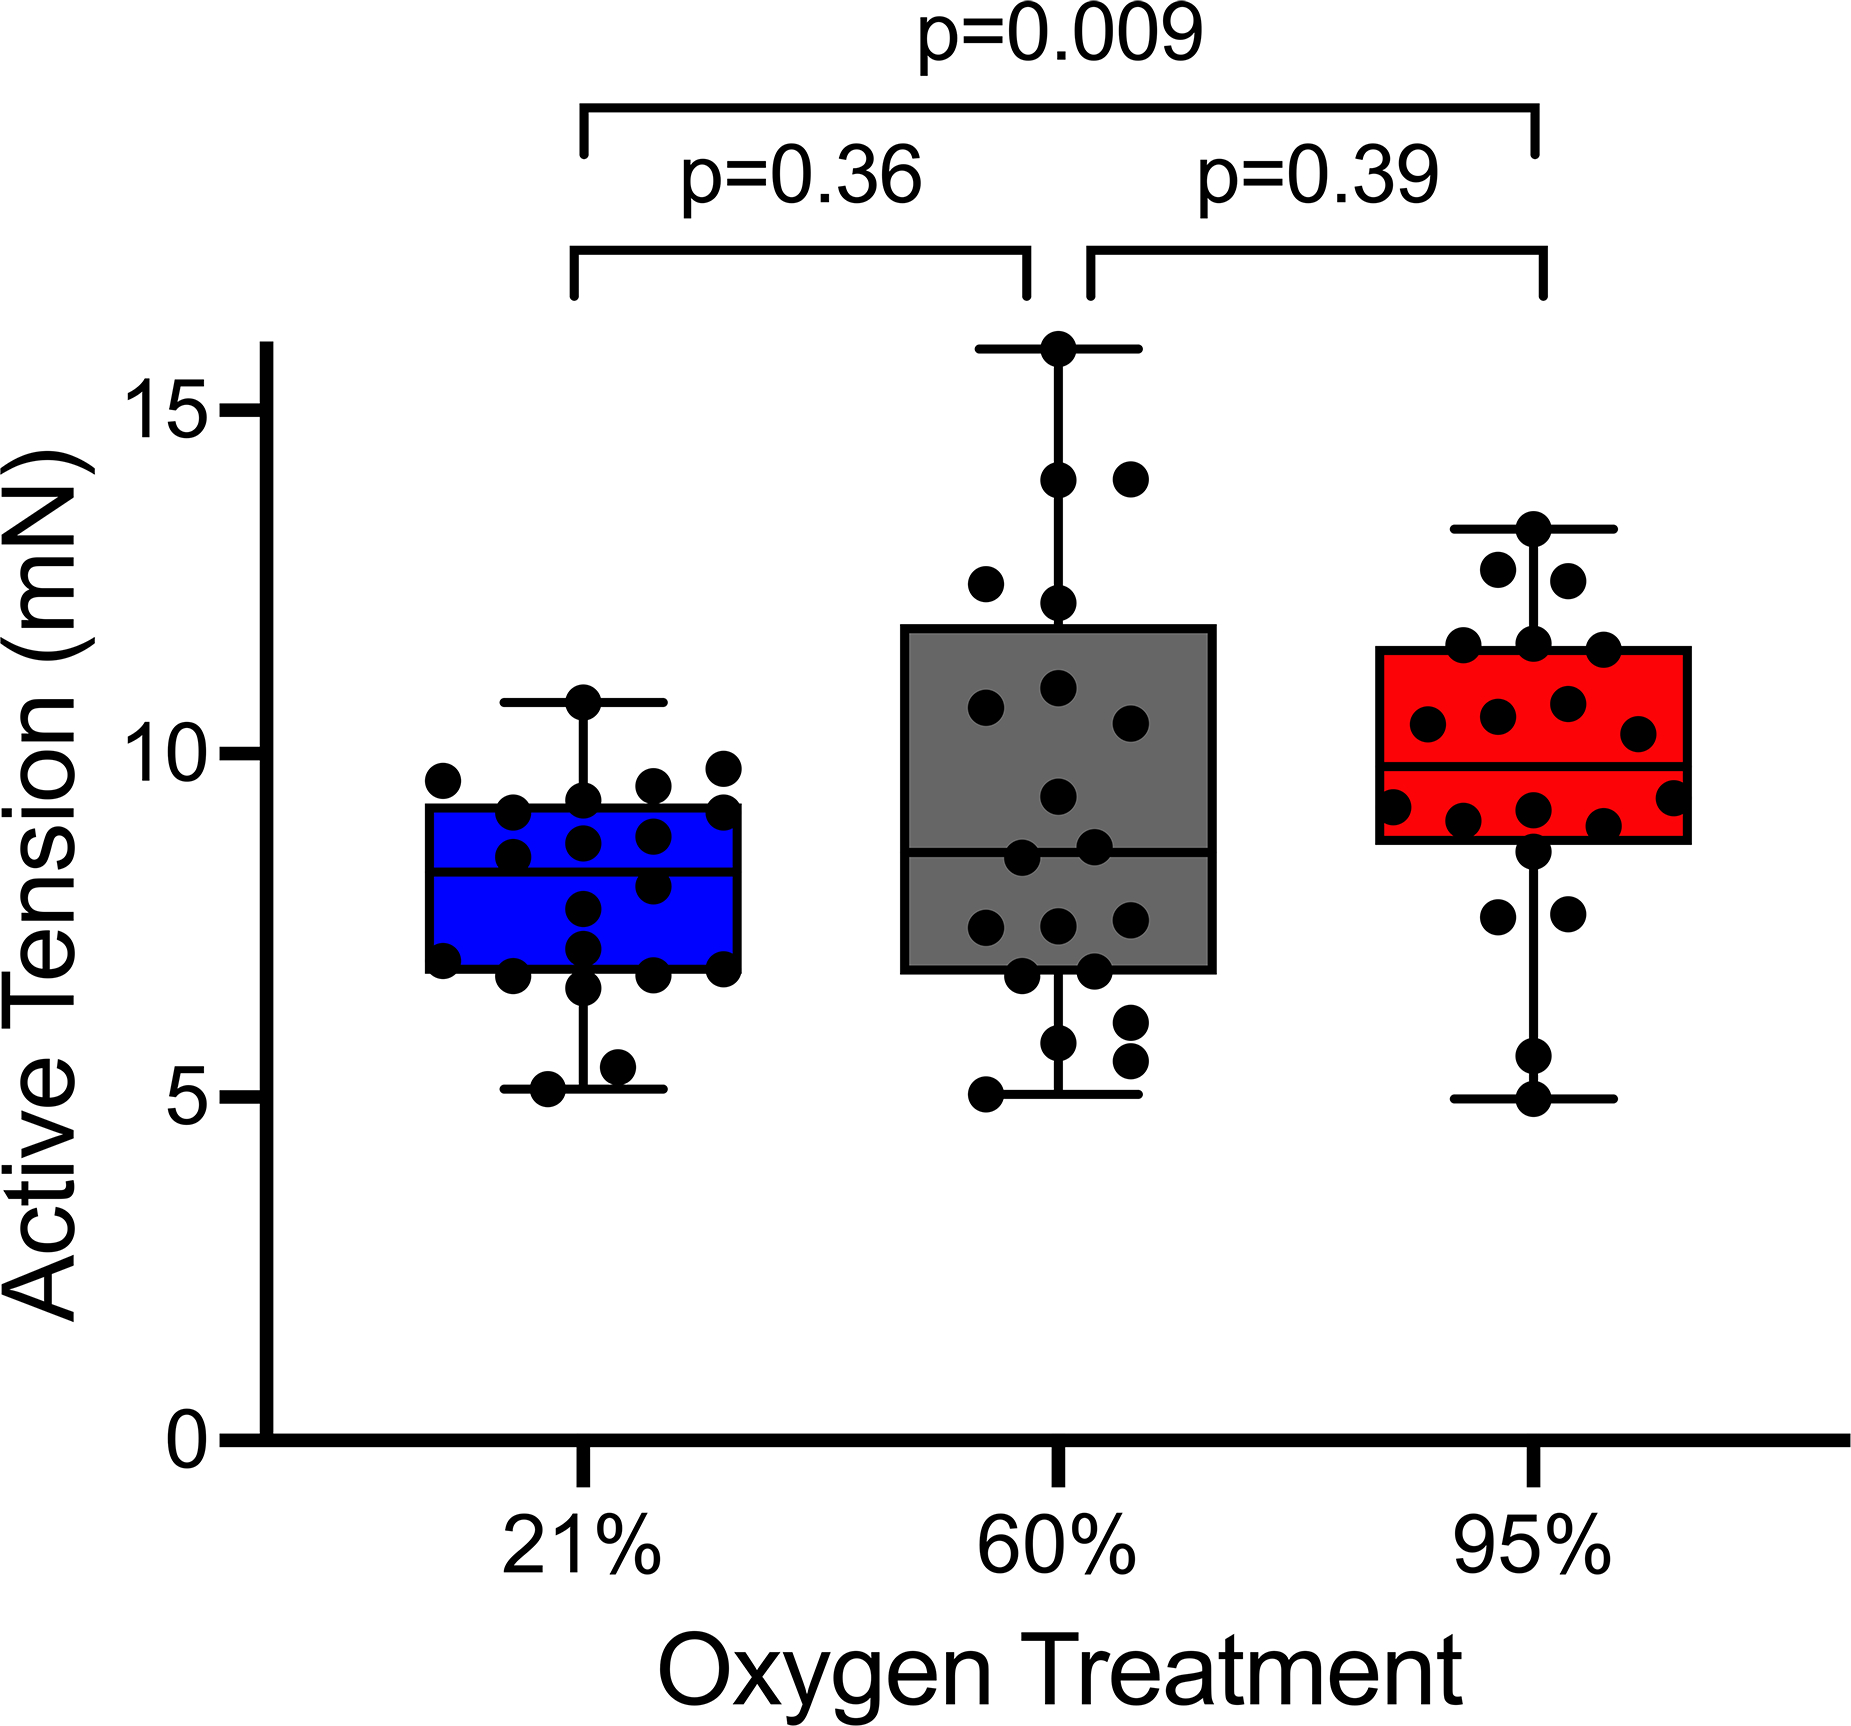
Effect of oxygen treatment on vasoconstriction in response to norepinephrine. Box and whisker plots represent the median, 25th and 75th percentiles in the box, and the minimum and maximum values as whiskers. Each dot represents one aortic ring (n=20 per group). p=0.03, effect of oxygen treatment across groups using the Jonckheere trend test. Comparisons between individual oxygen treatment groups used the Wilcoxon rank-sum test.